
My idea is to not complicate on start. Every day manually set stop loss for my positions. Buy everything that is 1, 1.5% above bottom and sell when price is up between 2-3% randomly picked on that scale. Have max daily exposure in meaning I have 1000 $, my exposure in market is 30% in one moment.
By a piece at the end of each red day.
As I look at the hourly BTC chart, there is the 50 days MA about to cross the 200 MA downside. I take it as a bearish signal at least for the next couple of days. Maybe an opportunity to short BTC. I would put the buy and sell limits at 2.5% around the actual 6880 US$ price.
Seems very difficult with the initial level of education I have, but following these guidelines I think I’ll be looking for daily movements over a week and apply RSI, OBV and MACD. If I’m able to find a weekly/monthly support/resistance level then I’ll try a out a idea similar to scalping only that without borrowing any capital, using 2% of the account only to get used with the movements, making small profit/loss while learning.
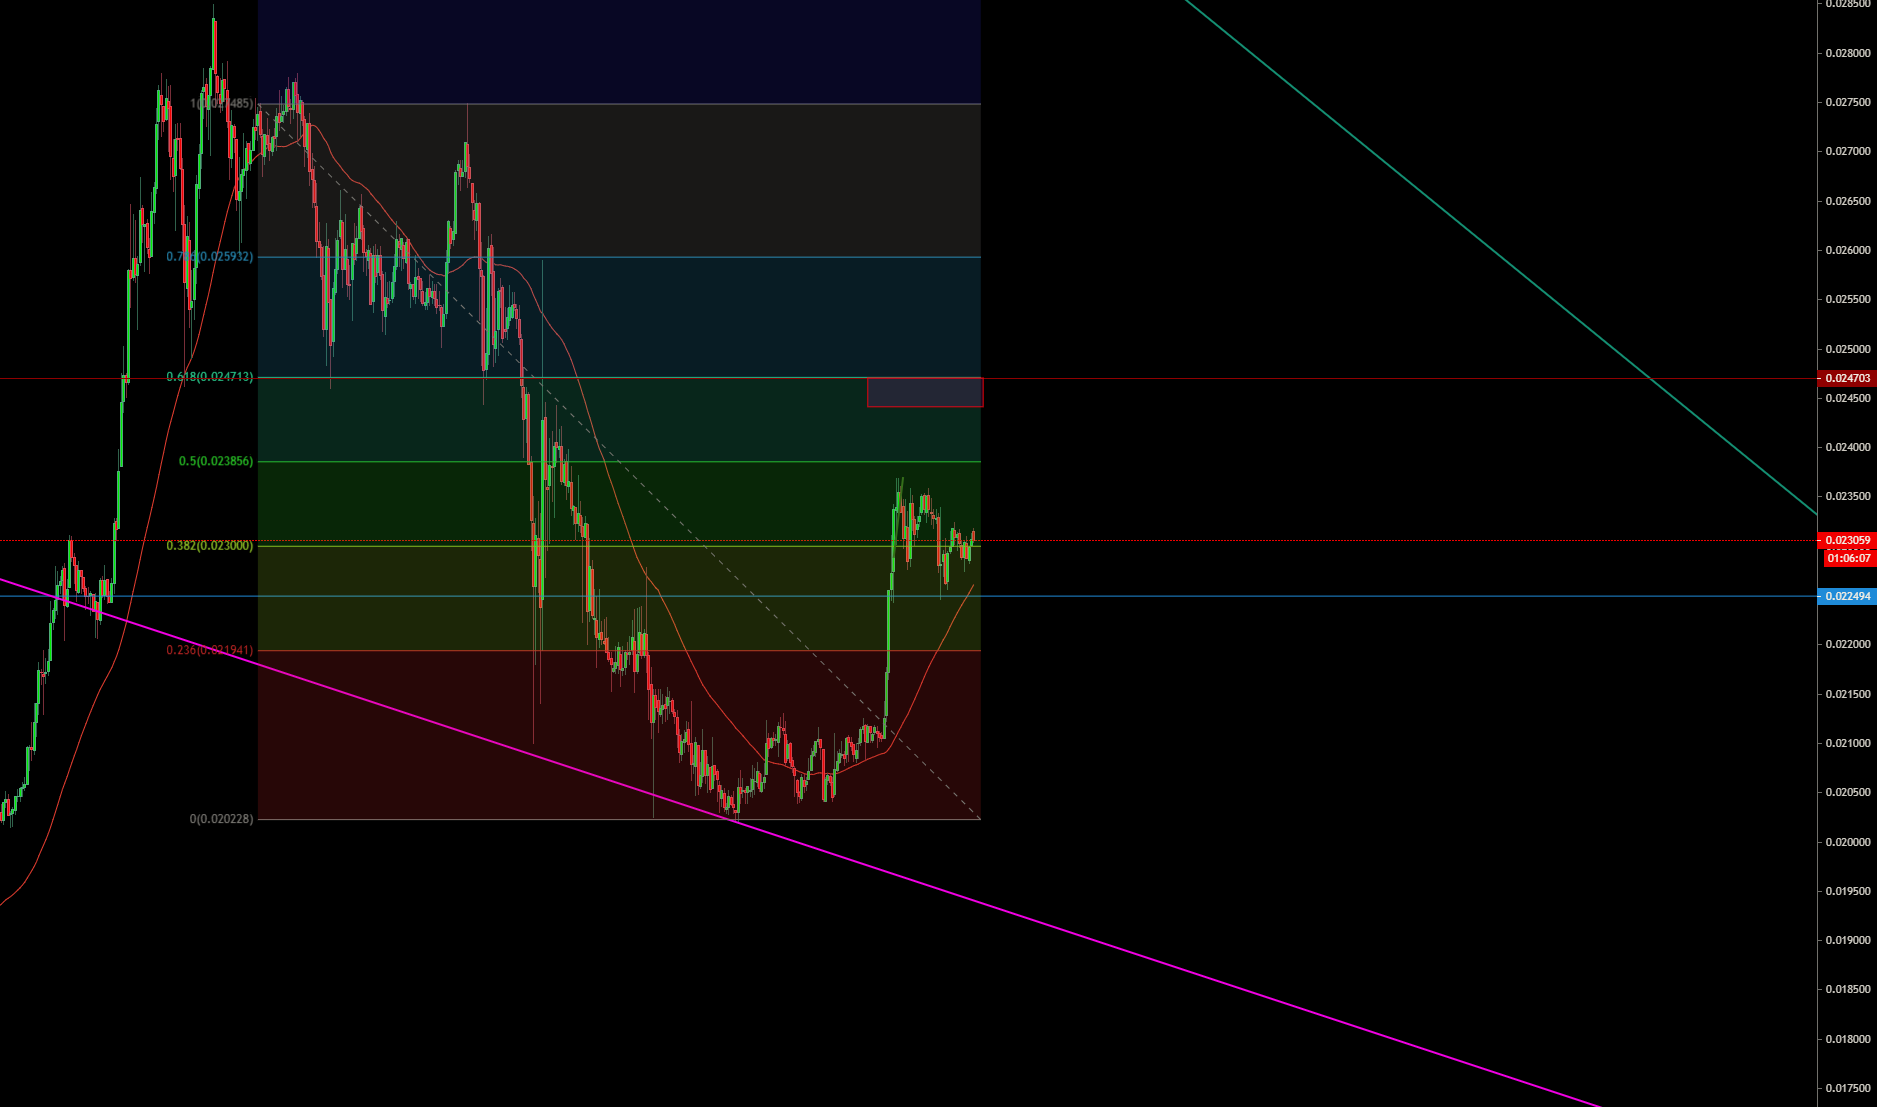
Drawing fibs seems to be really reliable when it lines up with other indicators.
Example: https://i.gyazo.com/cc6bea825adeab196a3777448b1fa3d6.png
Fib + past support now becomes a resistance. And it seems like its making a bull flag so maybe it actually reaches the 0.5 level.
(Still didn’t play out, maybe you can follow it aswell ETHBTC)
This one is a fundamental analysis and i realized its a waste:
-) I thought its important to find out what the current sentiment in the market is and who is actually selling and buying. COT releases data each Friday for Tuesday, so there is 3 day delay but you can see % of retail traders that went long compared to institutional traders. And there’s been plenty of times that i followed this where institutional traders got completely wrecked, so scratch this one.
Good indicator but i think its not free though.
https://www.tradingview.com/wiki/Volume_Profile
Shows you total volume that has occurred at that specific price level at specified time period. It relies on past price movements and volume behavior.
long term idea could be buy now and wait one year or two after halving and see what happened.
Never risk more than 10 to 20% of the total account balance in any trade. Small-Cap crypto one hourly and weekly charts.
Use the Fibonacci retracement as a great guidence.
Combine with MA(200) and crossover MA(50) and OBV.
- I do not short unless there is many strong indicators and watch news update
Use EMA for trends and stop loss.
Respect stop and take profits along the way.
Position on BCH - April 15th 2020
- last week it broke out of its Triangle and retesting breakout line forming a pull back which could be an indicator of an up trend.
- Watching the 20 EMA closely and indicating a strong upward trend starting to happen
- Current price at $222 usd
- After Analyzing many indicators and showing over sold and combining current news I’m anticipating sharp price movement in the next couple of days lasting to the end of April 2020. The Fibonacci is showing high prices on April 16th to 18th and another big rise on April 29th.
- Im going Long and take profits along the way with dollar cost averaging and protect myself with stop losses set.
Looking at Bitcoins chart for the last year June 2019 as the market peaked to around 14,000. then July 1st. 10,500. back up to 12,500. July 9th.and then started falling from Sept. high 10,600. till 24th to 9800. It started a up and down pattern for a while till November 23rd 6800. We started the new year great to 10,400. and after that the shit hit the fan(the virus). I was looking after the fall in middle of March and could see what looked like a couple of flags forming. That looks bullish to me so I would have bought there for a long position because it fell so hard and hold it till I wanted to sell my position. It stinks, thinking to change my thought pattern when your a hodler.
Current trading bot
I will first tell you what I am already doing at the moment. I developed some easy bots in Python running on my Raspberry Pi. What do the bots do? These bots are doing grid trading. Usually I trade an altcoin -bitcoin pair with these bots. Grid trading means that my bots have a grid of buy and sell orders in a particular market, for example BTC/ADA. The bot is not very intelligent since it works like that:
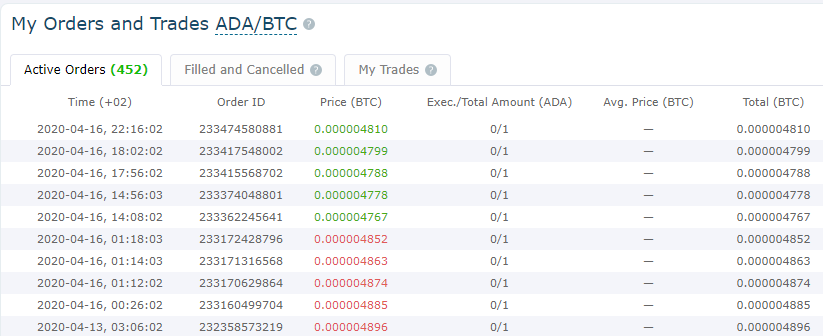
In the image one can see the buy orders in green and the sell orders in red. Please note that the prices are not in satoshi because the prices on HitBTC.com are 9-digit numbers. So all the orders are very small orders buying or selling a single ADA, which price is at 484 satoshis/ADA at the moment.
Looking at the order book you can see that my orders are everywhere in the market:
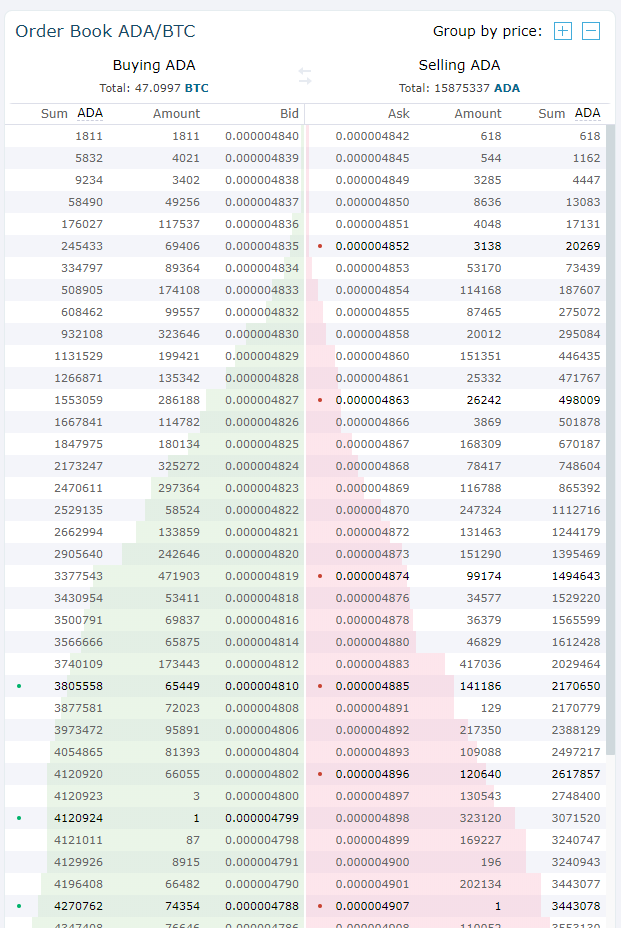
The green spots mark my buy orders and the red spots mark my sell orders. All my assets in this very small test setup are about 18 USD at the moment. I check how my bot is performing by using a Python script printing the current value of my portfolio:
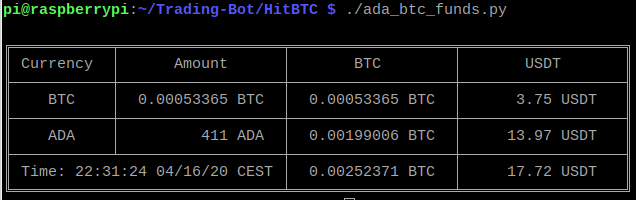
These snapshots of my portfolio are taken every 12 hours. And sometimes I try to find a day in history where I had exactly the same amount of ADA. And then I can measure how much my number of satoshis had been changed since then.
As you can see this is only a small test setup. The bot is executed every 2 minutes by the cron daemon. If a sell order has been executed the bot will have enough BTC funds to put a new buy order for a cheaper price. If s buy order has been executed the bot will have 1 ADA to set a sell order for a more expensive price. High volatile markets increases the reward of the bot, since many orders are executed and the revenue is about 1%. The bots creates about 0.01 USD per day, which is not very much, but it is decent because the investment is less than 20 USD. But if you see the yearly return, it should be about 18%.
Problems with grid trading
Now to the problems of my bot. Since this grid of buy and sell orders is distributed across a wide range, most of the orders will never be executed at all. But if you set the range of your grid too narrow, you will have the problem that the price may escape out of this range and your orders will not be executed until the price will come back to the range of your orders. For example if your altcoin goes to the moon, you will only have BTC left, which is not necessary a bag thing. The more likely scenario is that BTC will moon and the altcoin price will drop below your order range and you will only have the altcoin left. This is the reason why I usually choose a wide range with my orders. Sometimes I also put some BTC or ADA aside just for case of a huge price movement of one asset. But this also means that part of your portfolio is not part of the order book and therefor is not traded automatically. Since my assets are crypto only the price in USDT is subject to large fluctuations. If BTC goes up, my portfolio is doing very well, but if BTC goes down, the value of my portfolio is dropping fast. However the bot is gaining something because if the price goes up and down to the same level the portfolio will end up with some satoshis more. So at least I consider that the bot is better than just holding some BTC and some ADA. But I must admit that if one asset is considerable outperforming the other, this bot may be worse than just holding.
Now to my new idea:
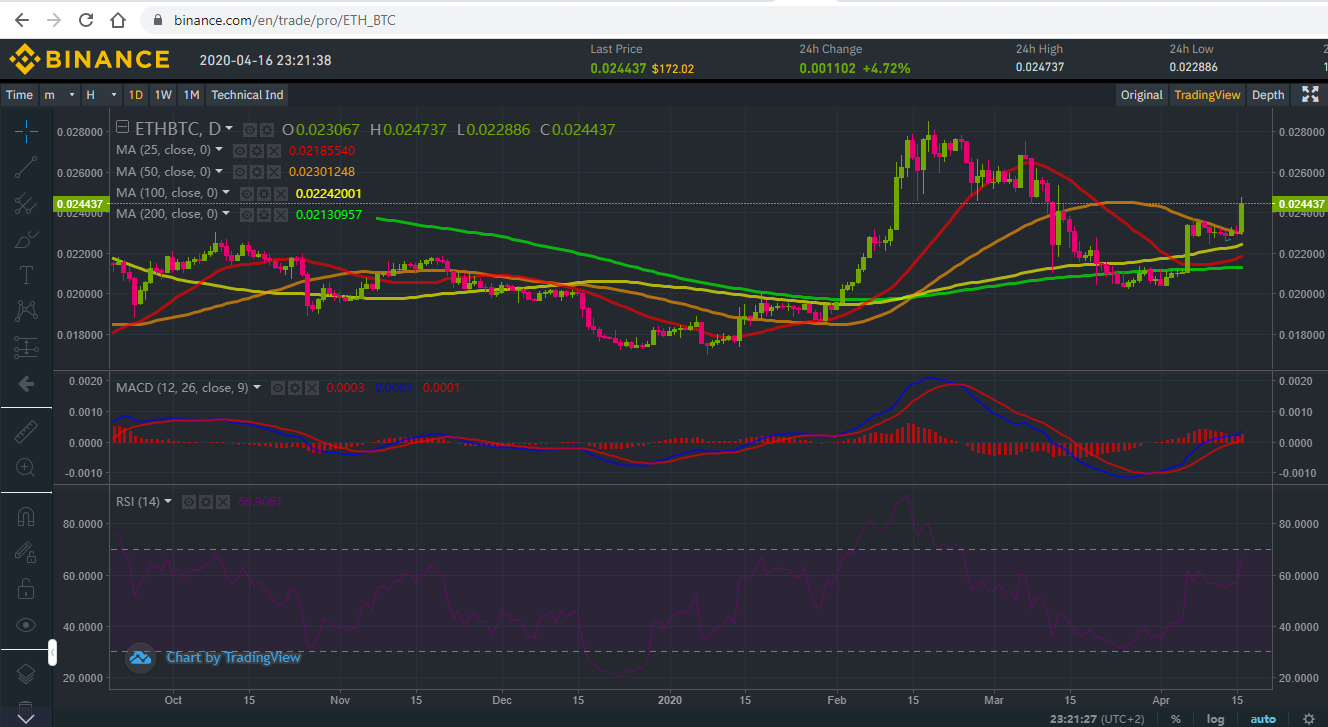
I want to develop a bot which can do trades based on technical analysis. My idea is to run it at the most important BTC-altcoin market, which ist BTC-ETH. On Binance you can put more sophisticated orders that take profit and have a stop loss as well. In order to avoid too much noise the TA will be calculated at least at a daily time frame and I am planning to use the MACD and the RSI to trigger buy and sell signals and additionally some Moving Averages like 25-day, 50-day, 100-day and 200-day to get an idea of the overall market trend. Since this is also a pure crypto currency bot I plan to increase my BTC and my ETH. Easily speaking just try to figure out if BTC or if ETH is performing better and holding this asset until the trend changes and then switching to the other one.
2 Likes
long term, easy to code strategy for BTCUSD on 1D chart.
Dollar cost average while BTC is below 200 MA, hold while BTC is above 200MA and then sell once the bull run is broken e.g. BTC falls below 200MA.
Will catch not the bottom or top of a trend but a big chunk of the move. I imagine that coding this in is pretty simple but with such a long term strategy perhaps its easier just to execute it by hand on an exchange.
For a shorter trategy I suppose I would be looking at using bollinger bands, macd and rsi to achieve some kind of confluence.
1 Like
5m chart
Selling Rules
- Stochastic indicator must be in the overbought region, which is the 80 level region as seen on the chart example above.
- the two lines of the stochastic indicator must cross in this 80 level region.
- Wait for a bearish reversal candlestick to form and that is your sell signal
- place a sell stop order 2 pips below the low of this bearish candlestick.
- then place your stop loss 2-5 pips about the high of that candlestick but if the stop loss is too close to the entry price, then look for the nearest swing high and place your stop loss a minimum of 2 pips above it.
- for take profit target levels, you got 2 options, aim for a risk:reward of 1:2 or more or use the previous swing high point as your take profit target level ensuring that it is more than 1:2 risk to reward
Buying Rules
- Stochastic indicator must be in the oversold region, which is the 20 level region, refer to chart above to see the level I’m talking to here.
- the two lines of the stochastic indicator must cross in this 20 level region.
- Wait for a bullish reversal candlestick to form and that is your buy signal
- place a buy stop order 2 pips above the low of this bullish candlestick.
- then place your stop loss 2-5 pips about the high of that candlestick but if the stop loss is too close to the entry price, then look for the nearest swing low and place your stop loss a minimum of 2 pips below it.
- for take profit target levels, you got 2 options, aim for a risk:reward of 1:2 or more or use the previous swing low point as your take profit target level ensuring that it is more than 1:2 risk to reward
1 Like
There seems to be a steady increase of BTC since 12/03, although quite bearish. the 9d and 20 day MA is rising, but 50 day MA is falling although I think that falling 50 day MA will turn soon. As of 20/04/2020 @ 22:00 BTC is at 6844 - 6% (24h). I expect this rise again to about 7200 in next 24h. As a short-term trade I’d buy some BTC now and sell some after approximately 24 hours later while keeping the rest to see what happens after the halving.
My idea is to trade on short time periods.
For longer term on daily chart:
Using MA 20, 200 to see when 20 crossing above 200, if its happening with enough volume, its good sign for bullish trend.
On 5 min chart use RSI or/plus MACD to catch to optimal point to enter or exit a trade.
I decided to look at Bitcoin and explore the idea of going long. With the halving coming up I decided to look at the chart listed below dating back to the inception of Bitcoin in 2009. The first halving took place on November 28th of 2012. The second halving took place on July 9th of 2016. The next halving is expected to take place within a month. Historically bitcoin price has increased following the previous two halvings.
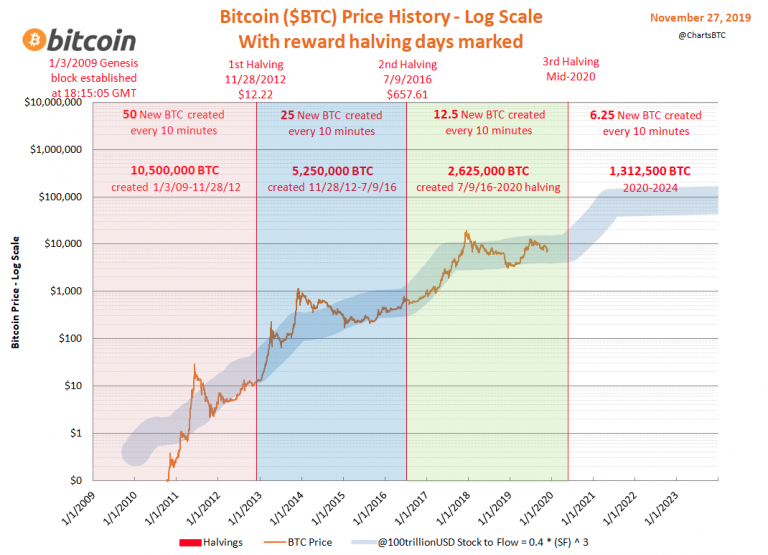
Recently (within about the past 24 hours,) Bitcoin has experienced a pullback from around $7200 to about $6600 before recovering to around $6900 currently. With the recession on hand, there has been uncertainty in the markets. As many people know, Bitcoin has never experienced a recession until now; so the results of this halving could be different. However, the previous pattern of price increase following the halvings indicate that this should likely be a bullish event. That said, this is the idea that I would explore with further TA if I were looking to establish a long position prior to the halving.
2 Likes
Buy at support, sell at resistance. A small idea
I’d like to test whether the relationship between volume and trading range as a function of uptrends and downtrends.
Buy when price cross over the 20 EMA
Sell when price cross under the 20 EMA
I dont have a to complicated strategy I sell when Bitcoin jumps up 10% because of the volatility and big price swings have made this strategy really effective. Yes sometimes I wait weeks without enough movement to buy or sell, but with patience, I get that 10% predictably.
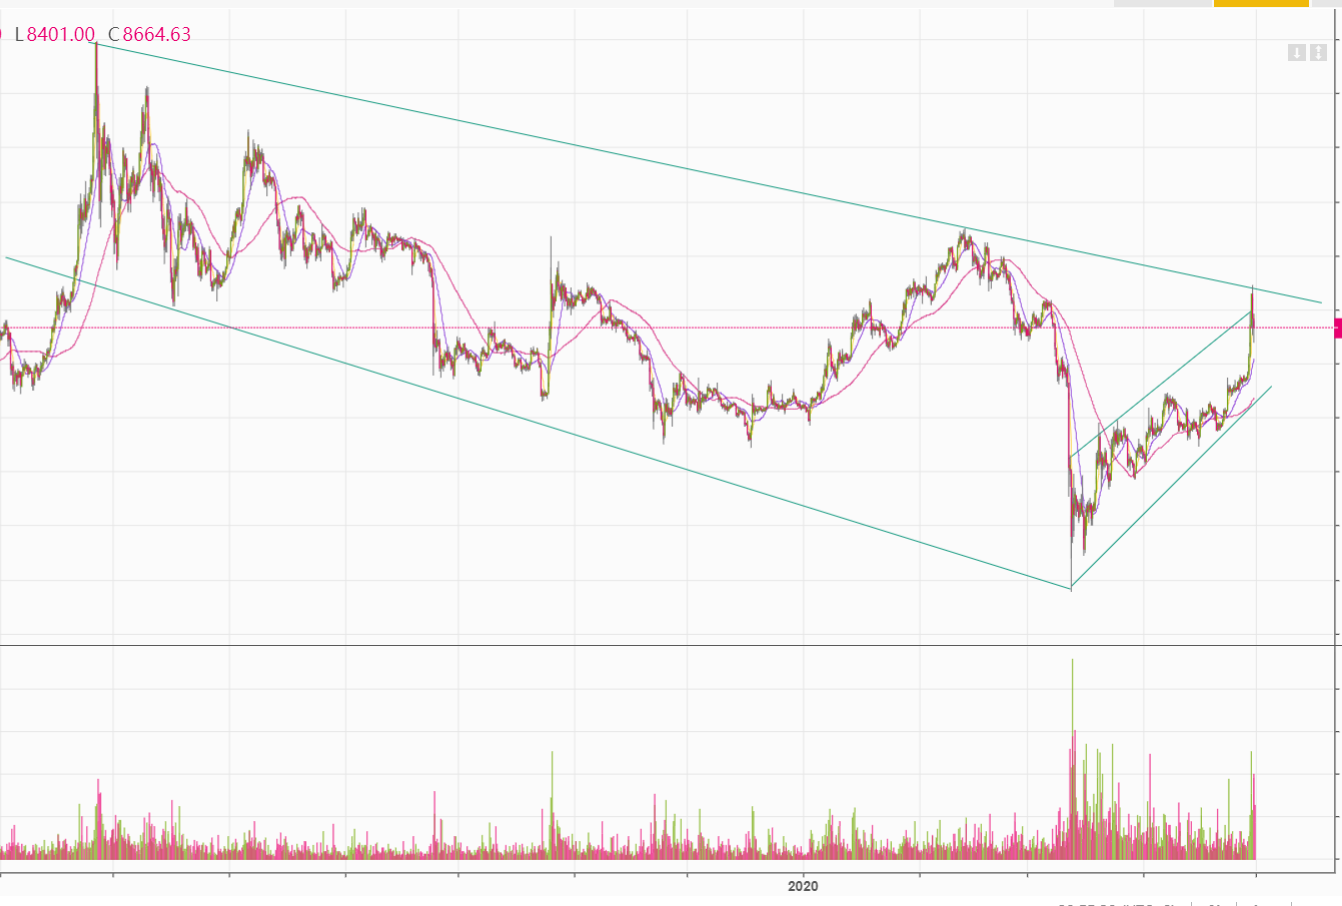
Here is my trading idea. You can see the 4H chart on Binance. A few days ago I started a long at around 7000 $ because of the small upward channel on the right sight. I closed it as when BTC price hits 9000 $. After this I started shorting from 9400 $ because of the resistance at the downward trend. It perfectly reached the resistance of the big downturn channel (around 9500 $). I will take profit when BTC reaches 8000 $ and I will close the short trade if BC goes above 9700 $. When BTC goes above 9700 $ I will open a big long position because the big downtrend channel will be broken. What I am a little bit worried about is the big downward trend. In my opinion there is still the possibility that BTC goes to 6000 $ again. What is your opinion about the big downward channel? I mean the resistance of the downtrend channel holds perfectly…