I look for double bottom to long and double top to short.+ if RSI has gone below 50 and then flipped back to up trent, its a buy signal.
Long when RSI is bellow 30 ; Short when RSI above 75
I also wait for stochastic RSI cross and macd cross for confirmation
using moving averages is also good for support/ resistance levels
https://www.tradingview.com/x/urnWERpS/
I follow the trend (both at micro & macro level) and focus on the RSI.
In this example we see that the value of ETH grows every time RSI goes below 30.
But in this case the trend is negative therefore I would only try trades on the very short time frames.
I entered the market after the collapse in March, as I was sure the market would recover.
As I’m Writing this, BTC is trending down in a tunnel on the 30 min chart. I would draw the top and bottom lines of this tunnel, take profit roughly 80% up and start to short when the price is about 90% to the top.
I have been trading Bitcoin little over two years now and I see this one thing repeating over and over again. Triangles. We go from big move, up or down with high volatility in the price action and then calm down for few days and when volatility decreases we usually create some kind of triangle or pedant which will breakout sooner or later. This breakout, no matter up or down is one I’d want to trade. Usually the price target hits or at least close. This is the strategy I want to automate.
LINK/USD on the daily chart looks primed for a possible short. Sitting at $3.43 right now. Stoke RSI is pointing down and the MACD fast line has crossed over the slow line and is falling below 0. First support is around $2.70 at the 200 daily MA, and if it falls below that I would look for next support at around $2.40. OBV is also flattening after having trended upward.
Stop loss just below the support level and limit buy just above the support level if an upward trend continues in MACD.
Pretty new to this but a simple strategy will be
Instrument: Enjin
Resolution 7 day
Long: when MAV(2days) goes above MAV(7days)
Short : when MAV(2days) does below MAV(7days)
Very basic !
Since I’m more of a HOLDER and not a day trader and I am just learning about financial chart patterns, this is more of a behavioral observation of a buying trend.
It seems that buying tendencies (and subsequently increased prices), are more prevelant over the weekend. Maybe because people have more time to sit down and buy if they work during the week. Prices then seem to drop heading into the week to varying degrees, and begin going up on Fridays again. It happens often enough that I’ve notice a pattern.
This is a DCA strategy that often has helped me net decent prices in the process. Maybe not the absolute lowest but not the highest either. Might be useful for others.
On 4 hour graph of BTC.
When BTC goes under it with high volume, there is often a change in trend direction so short with stop loss of high of candle, that went under ma21. Opposite for going above ma21.
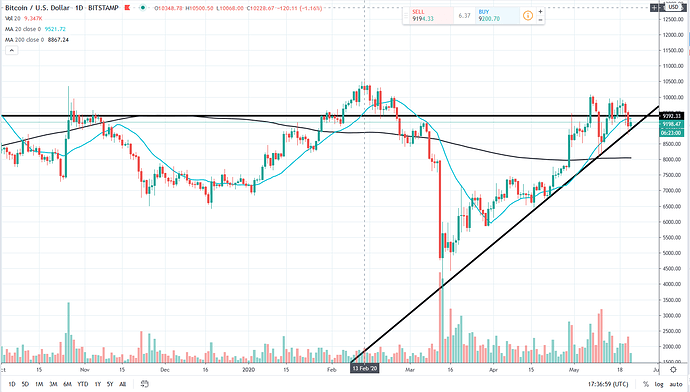
From my overall observation, btc tends to respect long term trend lines so anything using trend line + moving indicator should do good.
Buy when MACD >= -10
Sell when MACD <= 12
Buy or sell over 30 min intervals in day chart if at or below or above these levels.
DCA - 20% of full position each buy/sell
Date 22/05/2020
BTC/USD 1D timeframe, seems like the price failed to break multiple times the lower bound of the triangle. If the price breaks the horizontal line, a LONG position could be opened with Stop-Loss and Take-profit calculated with Fibonacci. It could be wise to set multiple take-profits as the market just witnessed an HALVING.
Using the " TD Indicator " a candle is considered green, only if it closed above three candles prior to it, and red if it closed below three candles prior to it. When a second green number trades above the prior candle, it is considered to count to 9, and then correct or cool down for 1-4 candles where you wait for another entry to either side. a 2 above/below a 1 is the best entry as the count still has 7 candles to go, the entry becomes less favorable if later numbers start breaking out. Profits can also be taken on earlier candles and does not have to wait for a 9.
On a daily chart, when a second green day trades above a first green day, the markets usually indicate a top on the ninth day, and the same for red numbers going down showing a bottom.
This idea can also be executed by betting against the market on a 9 red/green, finding an entry point on smaller time frames.
A safe stop loss could follow the low of the previous candle, if the gap is too big the entry will be less favorable, or higher risk, as the stop loss will be far away on entry.
An Ideal entry is a green/red 2 going above/below (respectively) the prior candle, while the prior candle’s % change is smaller than (10%) of the average candle size.
Long if RSI < 30 and MA (close, 12) > MA (close, 100)
Short if RSI > 70 and MA (close, 12) < MA (close, 100)
Strategy will be long term. I will buy when:
Candle show 600+ point loss
RSI: is below 30
We will call this… the “newb strategy”
I don’t sell and buy crypto in the short run so my startegy is VCA wich normaly have a cykle over a coupel of months.
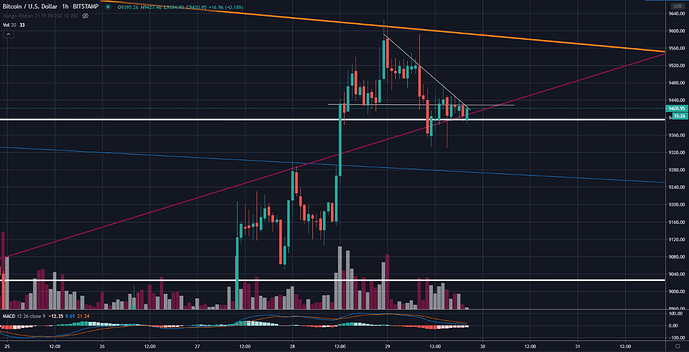
Already marked out monthly support/resistance levels (white) as well monthly downward trend line (orange). On the 1H TF, If MACD fast line crosses slow line from bottom to top, enter a long position with a target at the orange trend line. Otherwise if both fast and slow MACD lines go below zero, enter a short position with target at the bottom white support line.
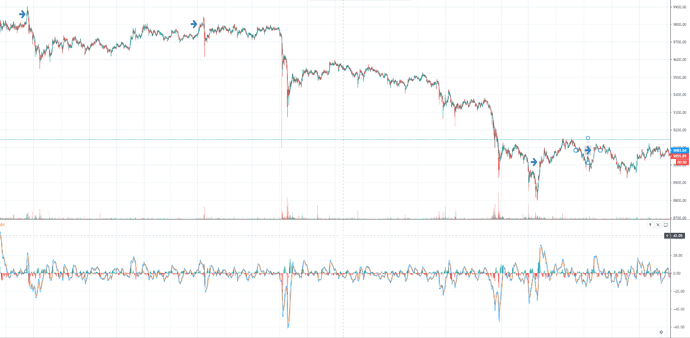
3 Down 3 Up repeating pattern
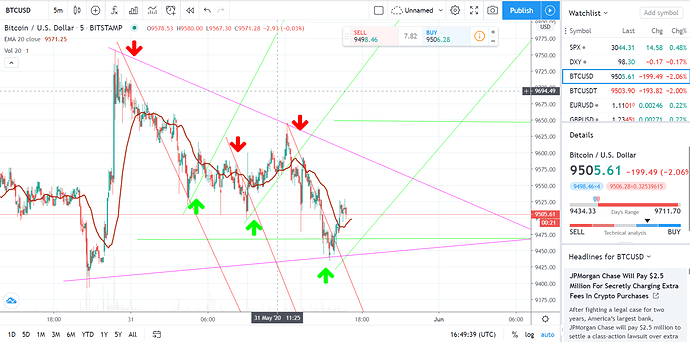
I just Eyeball it.
Horizontal Green Bottom would stop loos
Cross of Purple and Green take profit.
Just an Idea.
On LIINK/USDT 30min chart
SELL if price is above 9 EMA and RSI >= 73.5
after that BUY when the price = 21 EMA
a big candle down, and directly at least at the same hight a green candle, mostly a bullish sign…


