Trading Assignment: Find an idea

Time for the first Trading Assignment of this course. This time I want you to take a look at a crypto chart and try to find a trading idea. And just like I shared mine in the video, I want you to share yours in this forum thread.

I understand that this assignment can be difficult, but try your best. It doesn’t matter if the idea is good or bad, profitable or not - the point is to find SOMETHING.

12 Likes

Buy when low, sell 80% when high hodle a percentage (20% accumulate over time) when your in an upward trend market (maybe execute a position based on a certain pre-set percentage Pip movement) . Visa Versa in a downward trend market. Let your algo sail or surf the waves of the markets…driving you to the direction of a Lamborghini; or take profit once you have enough for a lambo!! [email protected]

6 Likes

Simple starter strategy for XBT (1hr or 30m TF):
Long = RSI(14) <= 30 and MACD Histo Bull Div and MACD signals <= -5
Short = RSI(14) >= 70 and MACD Histo Bear Div and MACD signals >= 5

I use EW and Fib for confluence with this strategy. I’m also testing this strategy with RSI of OBV (RSIa) instead of RSI(14) which gives a better indication of momentum. I published 3 indicators used for this strategy (Triple RSI with div, MACD with div and Demarker) on tradingview if anyone is interested search for [HC] in indicators.

15 Likes

Thanks for sharing @Hank

2 Likes

A possible idea is if the MACD “goes positive” and the price crosses the 50-period MA then buy
And if the opposite happens where the MACD “goes negative” and the price crosses the 50-period MA then sell.

2 Likes

This is my first basic idea on XBT (TF 1hr).
Long: the price line crosses EMA(24) line cross from below to above.
Short: the price line crosses EMA(24) line cross from above to below.

2 Likes

In time resolution 1d:
-Buy when price cross over EMA(21).
-Sell by placing trailing stoploss @ ‘lowest low’ of 7 bars, minus 5 for noise reduction:
[In trading view: “lowest(low, 7) -5”].

1 Like

Products: BTCUSD
Resolution: 15MIN
technical analysis: MACD(12,26,9)
Strategy:
Long when MACD cross over and MACD value<= -3
Close postion when MACD cross over 0 from below
Stop loss at the lowest low of previous 5 bar

3 Likes

buy or sell if a candle touches the bollinger band line.

if it touches the downside then buy
if it touches the upside then sell

7 Likes

Potential bull on a micro scale:

RSI(14) signal has ranged from <=30 to <50 for extended period (1 month for example) indicating strong buy signal.
Bull Flag presents pushing the RSI(14) >50 and holding above 50 after run.
A triangle pattern begins to form with the horizontal line being the resistance “ceiling”, and the trend line becoming the support “floor”.
Higher lows are created throughout this period presenting an upward trend. The RSI(14) stays equal to or just above the 50 signalling a “stale mate” between buyers and sellers.
As the tip of the triangle draws nearer, the RSI(14) dips just below the 50, presenting a possible breakout to the upside as one of the sides (buyers/sellers) has relinquished their position somewhat. Fake breakout may occur above resistance “ceiling” when RSI(14) retraces above 50, it indicates a potential bull run on a micro scale is about to occur.

1 Like

So far i can come up only with something as simple as

Buy at support level and sell on resistance while in upward trend.
Set the stoploss slightly below support.

Not sure how to formalize it yet ((

9 Likes

Actually my idea is not related with the chart, it’s purely numerical.

During one week, look at the price of Bitcoin at the same moment, let’s say at 12pm
Compute the MACD after this first week of observation.
Next week buy the first day below the MACD and sell the first above MACD

I don’t know if it is smart but this is my first idea

1 Like

I mostly look for certain candle formations (hammers, shooting stars and dojis) in combination with the RSI (overbought or oversold).

1 Like

A simple strategy could be to buy when EMA(9) crosses above EMA(25), and sell when EMA(9) moves below EMA(25). One could also try using MACD to make a better decision. For example, sell when MACD(12) crosses below MACD(25), and vice versa.

1 Like

In an upward trending market use a Fibonacci multiple as guidance to set stop losses. To protect from a downward movement, set an initial stop loss a certain percentage below the purchase price and hopefully move up as the market trends positive.

1 Like

OK very new to this sort of thing so here goes.

On 15m resolution with an MA20 line and an MA50 line.

Buy when the MA20 crosses above the MA50. Sell when the MA20 crosses back below it.

Very basic but hey its an idea!

1 Like

One simple trading idea could be to long BTC when price reaches a support level and sell it when it reaches resistance level.

It’s August 17th 2019 and this is my idea:

The BTC made a bull run from $4K in March 2019 and reached its peak in Jun 2019 at $14K

The question which state btc is now in August and September 2019?

The Weekly chart, RSI showed a bear run while the Monthly chart, RSI already at 93, a sign that showed btc gonna be in consolidation state.

So, I need to find out the support and resistant in daily and weekly chart.
On 17 Aug 2019, the 1W showed the strong support at $8k6 and 1M showed strong support at $7k4. So, my Idea is to step in Short Position when btc price is over 10K and step in Long Position when btc reach 8k6 and 7k4.

At this time, the current btc price is 10k3, I’ll place 2 orders:
1/ Short 1 BTC if BTC price reach 10k580, (SL at 10K7 and TP at 9K2)
2/ Short 1 BTC if there is a 4H candle below 10K2 (SL at 10K3 and TP at 9k2)

Is it worth? Yes!!!

3 Likes

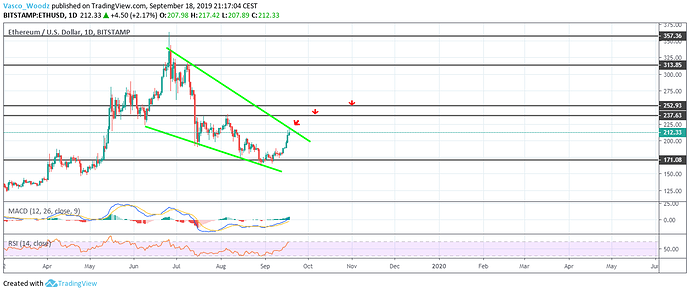
For the purpose of this assigment I used ETHUSD chart below, 1d time frame.

As you can see, I can identified the key support/ resistance levels on the larger time frmes in order to get the more reliable price levels.
Then, I identified that there was a substential downtrend movement since the end of June. Both green tradlines also act, as additional support/ resistance levels.
I set up two alarms - the first one at the price level USD 223, which is a bit above the upper trade line. The second one at the price level USD 238, which is a major resistance level.
The brek through the first price level will indicate that there might be trend reversal and I should further invistigate my position entrance by using RSI and MACD. I would look if the price movement is supported by the rising MACD above 0 and its crosover with the signal line. I would examine RSI very careful, as it might shown a false signal of the asset beign overbough if there will be a large buying wave (if all of the other alcoins will be raising at the same time, a high RSI might be ignored).
The brakethrough above the second (horizontal) resiatnce at the price level USD 238 will be a much stronger trend reversal indicator. At this point, I can easily open a long position with a take profit at the resistance - USD 252.
let me know what you think :slight_smile:

4 Likes

When MACD turns in red on 1day chart we go short, when turns in green we go long. Simply following the trend. As well we can use OBV indicator for trend reversal on 1day chart. And when we see according to MACD and OBV that trend is changed we can trade that. Its more longer term trade but less risk and bigger reward in my opinion.

3 Likes