
very clear. great explanation:muscle:t6:
1 Like
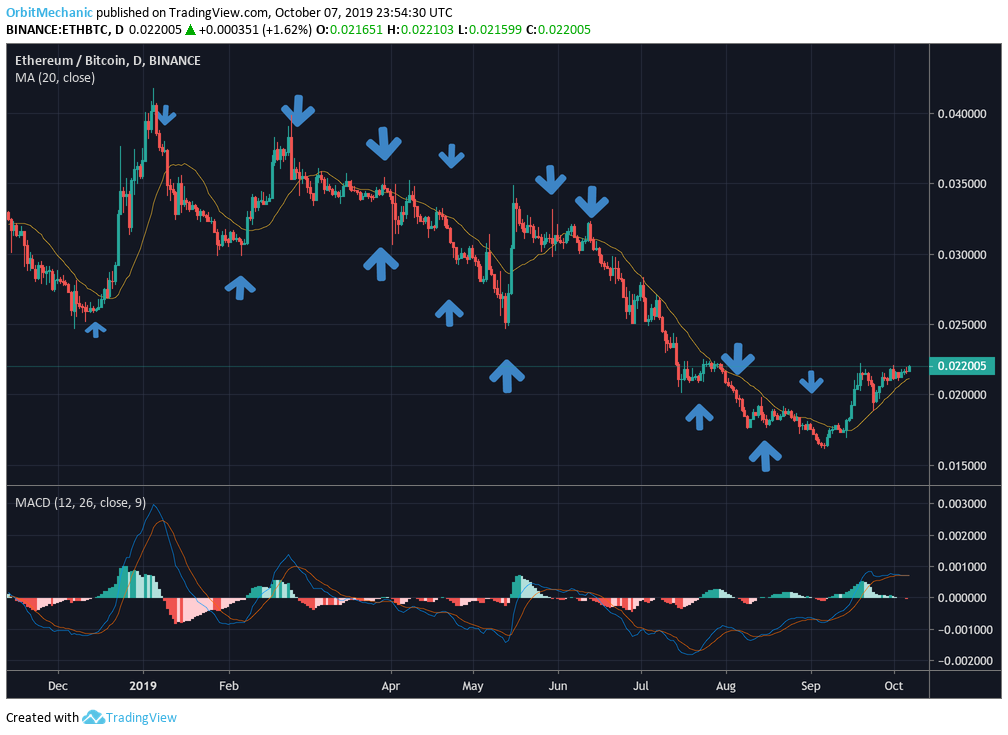
I’m trading on the ETH/BTC pair.
I tried all the usual indicators: MACD, MA, Stochastics, Bollinger Bands, Chaukin Money Flow, and etc. By themselves nothing rises above zero-sum-gain and most do far worse.
For the exercise let’s brute-force it with MACD crossings.
Its apparent to be profitable considerable subtly will be required.
2 Likes
Using MA-13 and MA-34
When 13 crossing 34 up-long
When 13 crossing 34 down - short
1 Like
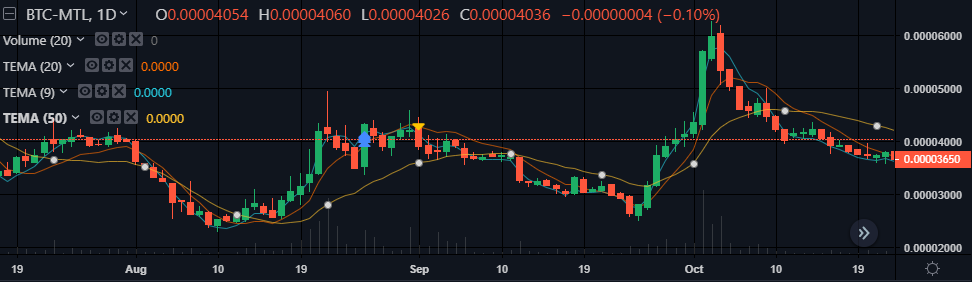
I’m using NPXMETH as Pundix was the project that introduced me to crypto. (Btc I know I know but pundi showed me the power of the blockchain In emerging/underbanked markets. this peaked my interest beyond speculation and prompted me to really look at the technology. Needless to say I’m a lol believer)
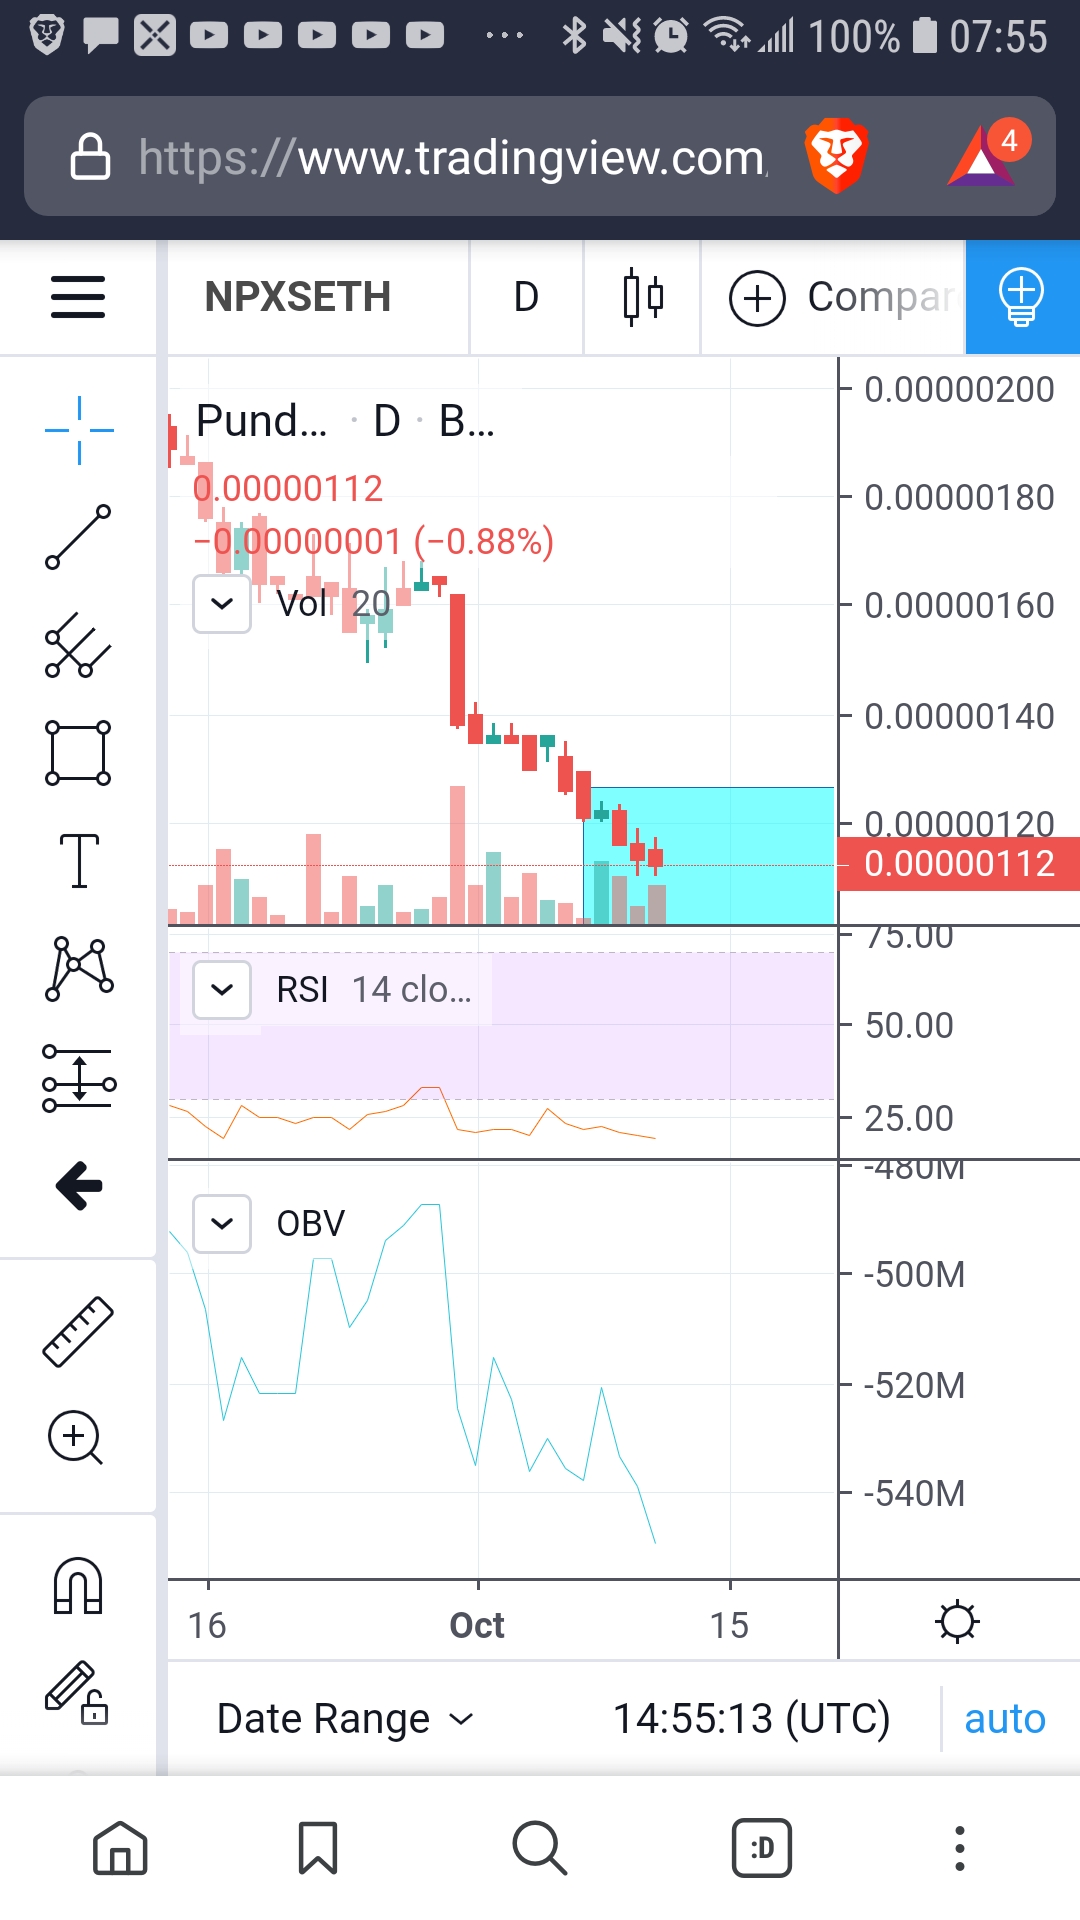
as one can see it’s been in an obvious down trend (really since late July/early August)
the Obv and the price are falling in sync not to mention the candles are getting thinner and thinner. I interpret this as a price bottom or very near it.
based on this and other research,
the fact The pair was recently accepted for trade on binance coupled with its partnership with the Samsung blockchain (supports the pundix mobile wallet), its integration into the veriphone ecosystem (largest retail point of sale device) and the partnership with government of Dubai I would
- buy at the bottom
- hodl current shares
3.look for bounce indicators and set a bullish long
1 Like
Gee… difficult questions
Im not good at shorting, so Id rather have a bot do the trades for me. It should do small day trades and make me a nice side income so I dont have to tend to the charts all the time.
2 Likes
Never risk more than 5% of the total account balance in any trade. Small-Cap crypto one hourly and weekly charts.
Use the Fibonacci retracement as buy levels
Combine with MA(200) and crossover MA(50) and OBV
Use EMA for trends and stop loss.
Respect stop and take profits along the way.
Marathon, not a sprint.
2 Likes
Now that bitcoin has fallen 5% I would wait to see if the price will consolidate and break EMA200
2 Likes
Seems so confusing to me with all these ideas.
. But the simplest I can think off will be to buy when price reaches to support level and sell when it nears or pass resistance.
1 Like
Taking a look at BTCUSD, using the 4 hour chart and taking RSI, OBV and MACD into account, I find it hard to make a decision right now.
If I could wait for a little while, however, my idea would be to wait for the RSI to go below 50, and for the MACD’s faster MA to cross below its slow counterpart. Seeing this happen would be the confirmation to open a short position. I would add a stop loss order around the 7700 dollar resistance, just in case the prices bounces back. I would then close the short position at around 6880 USD.
I must point out that I didn’t take margin interests or other commissions/fees into account.
1 Like
I am going to try to use the Stochastic Indicator on the 12 hours timeframe for BTC.
(K= 14 / D = 3 / Smooth = 6).
Buy when K crosses D upwards
Sell when K crosses D downwards
1 Like
I found that the open triangles are similar to each other on the basis of cause and effect (I wrote the scenario) based on sentiments, setting a stop loss (large enough because the market is specific). Not too much analysis.
1 Like
ETC/BTC chart on tradingvies ( Binance platform )
- Looking at 5 day chart, I’ll find moments where MACD and RSI are reversing and the long volumes pick up.
- Looking at the squeezing of the Bollinger bands and waiting to enter a long positions for the very short period of time.
- Setting a stop-loss at 5% under the entry level and take-profit signal at 15 to 20% above entry.
Not shorting anything and not using leverage.
2 Likes

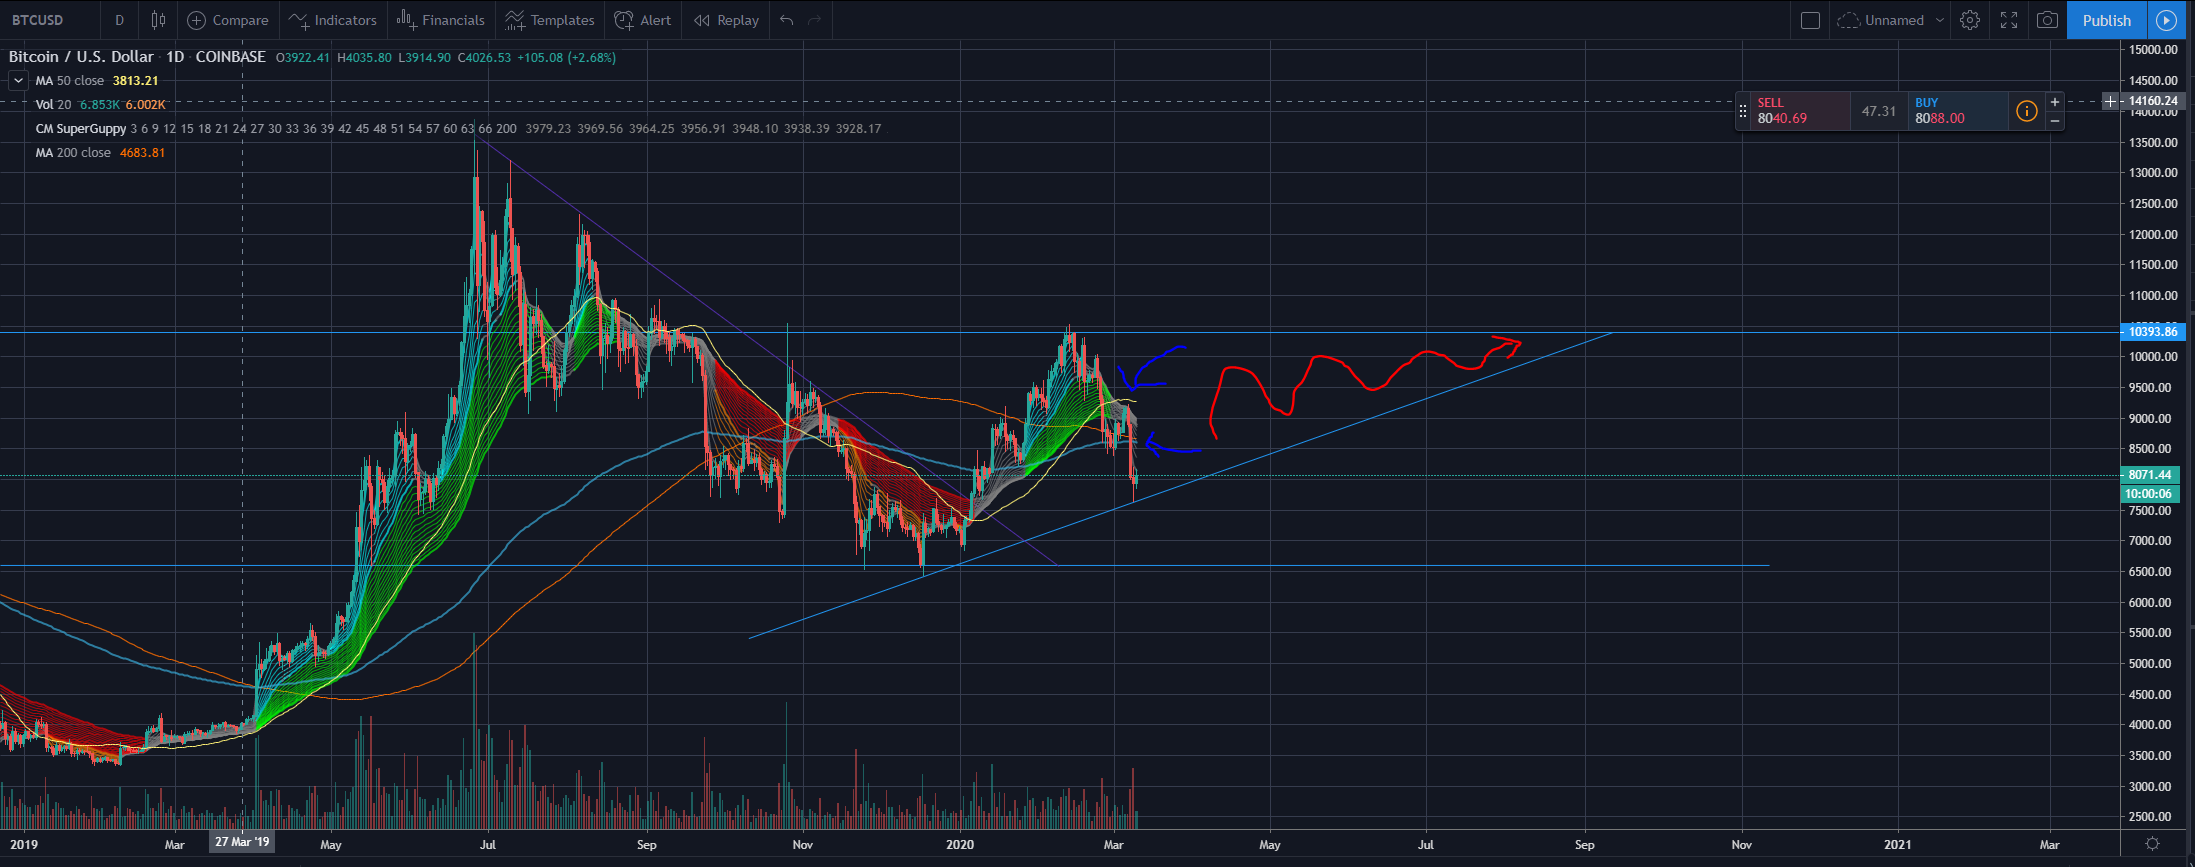
An idea might be to buy:
The line with the purple arrow is roughly a supportline since autumn 2018
The green arrow is where the MA 50 crosses above the MA 200
The white arrow is the RSI and this is 0.0028
But I do not understand which one is good to buy ETH or BTC? SO if someone has an answer I would love to know. The chart states: ETH/BTC
1 Like
Well maybe that is quite a bitten up idea, but there it goes…
Long = enter when RSI is below 24 and stochastic RSI fast-line above slow-line / take profit when stochastic RSI fast-line crosses slow-line. with managed risk in the stop-loss. ideally 2.5 risk/reward ratio.
Short = enter position when RSI is above 76 and stochastic RSI slow-line is above fast-line / take profit when stochastic RSI fast-line cross slow-line. with managed risk in the stop-loss. ideally 2.5 risk/reward ratio.
1 Like
Love the Bart head trend. Ive actually thought a bit about it. It is IMO (or in fact IDK) a sign of a small, under-capitalized market. These indicate a person or small group of insiders is manipulating the market. this can be seen in either up or down direction. An inverted Bart head is interesting in that a sudden drop is often soon followed by a quick rebound. By studying the duration of these sets of occurrences we may be able to find a signal to effect trades. different time framed charts seem to have the ,we’ll call it BH or IBH, well defined. Bascally it is a rapid move in one direction and holding for a certain period before returning or overshooting previous levels.
Although both can likely be exploited, this idea will concentrate on the inverted Bart head. IBH will need to be defined. 1. A sudden drop within 10 min of 1%. This is just a starting point but seems in the realm of possibility. The end of the drop will need to be defined as a period of relative calm. Let’s say less than twenty percent as volatile as the drop and more or less even. I’ll need further results.
I’m probably beyond “Idea” already …
I’ve found a number of examples where using the Triangle has been an effective way of seeing where volatility expands and contracts. This, coupled with the 50-day moving average crossing above the 200-day moving average would be an indication to buy.
As it is not possible to know for sure whether the triangle would be broken from a bullish or bear-sense, I would create a stop-loss 50 points below the triangle’s hypotenuse and adjust daily to factor in the upward trend. This way, if there is an unexpected bearish breakout, I would liquidate but would still gain from the steady up-side from up-trending variance contraction.
As you can see from the chart above, the 50-day moving average is above the 200-day. Should price volatility continue to contract until September, this would result in a gain of ~30% by September.
Hopefully this course will teach me to code so I can give it a try historically and see if it would be a profitable strategy 
Greatings to all This is one idea that came to me when i startet with this course and hoped to have got it wright because i made it through technical analysis . It’s a long term strategy but could be found and made for shorter periods of time too i thing but i could make it on one foto. BTC/USD
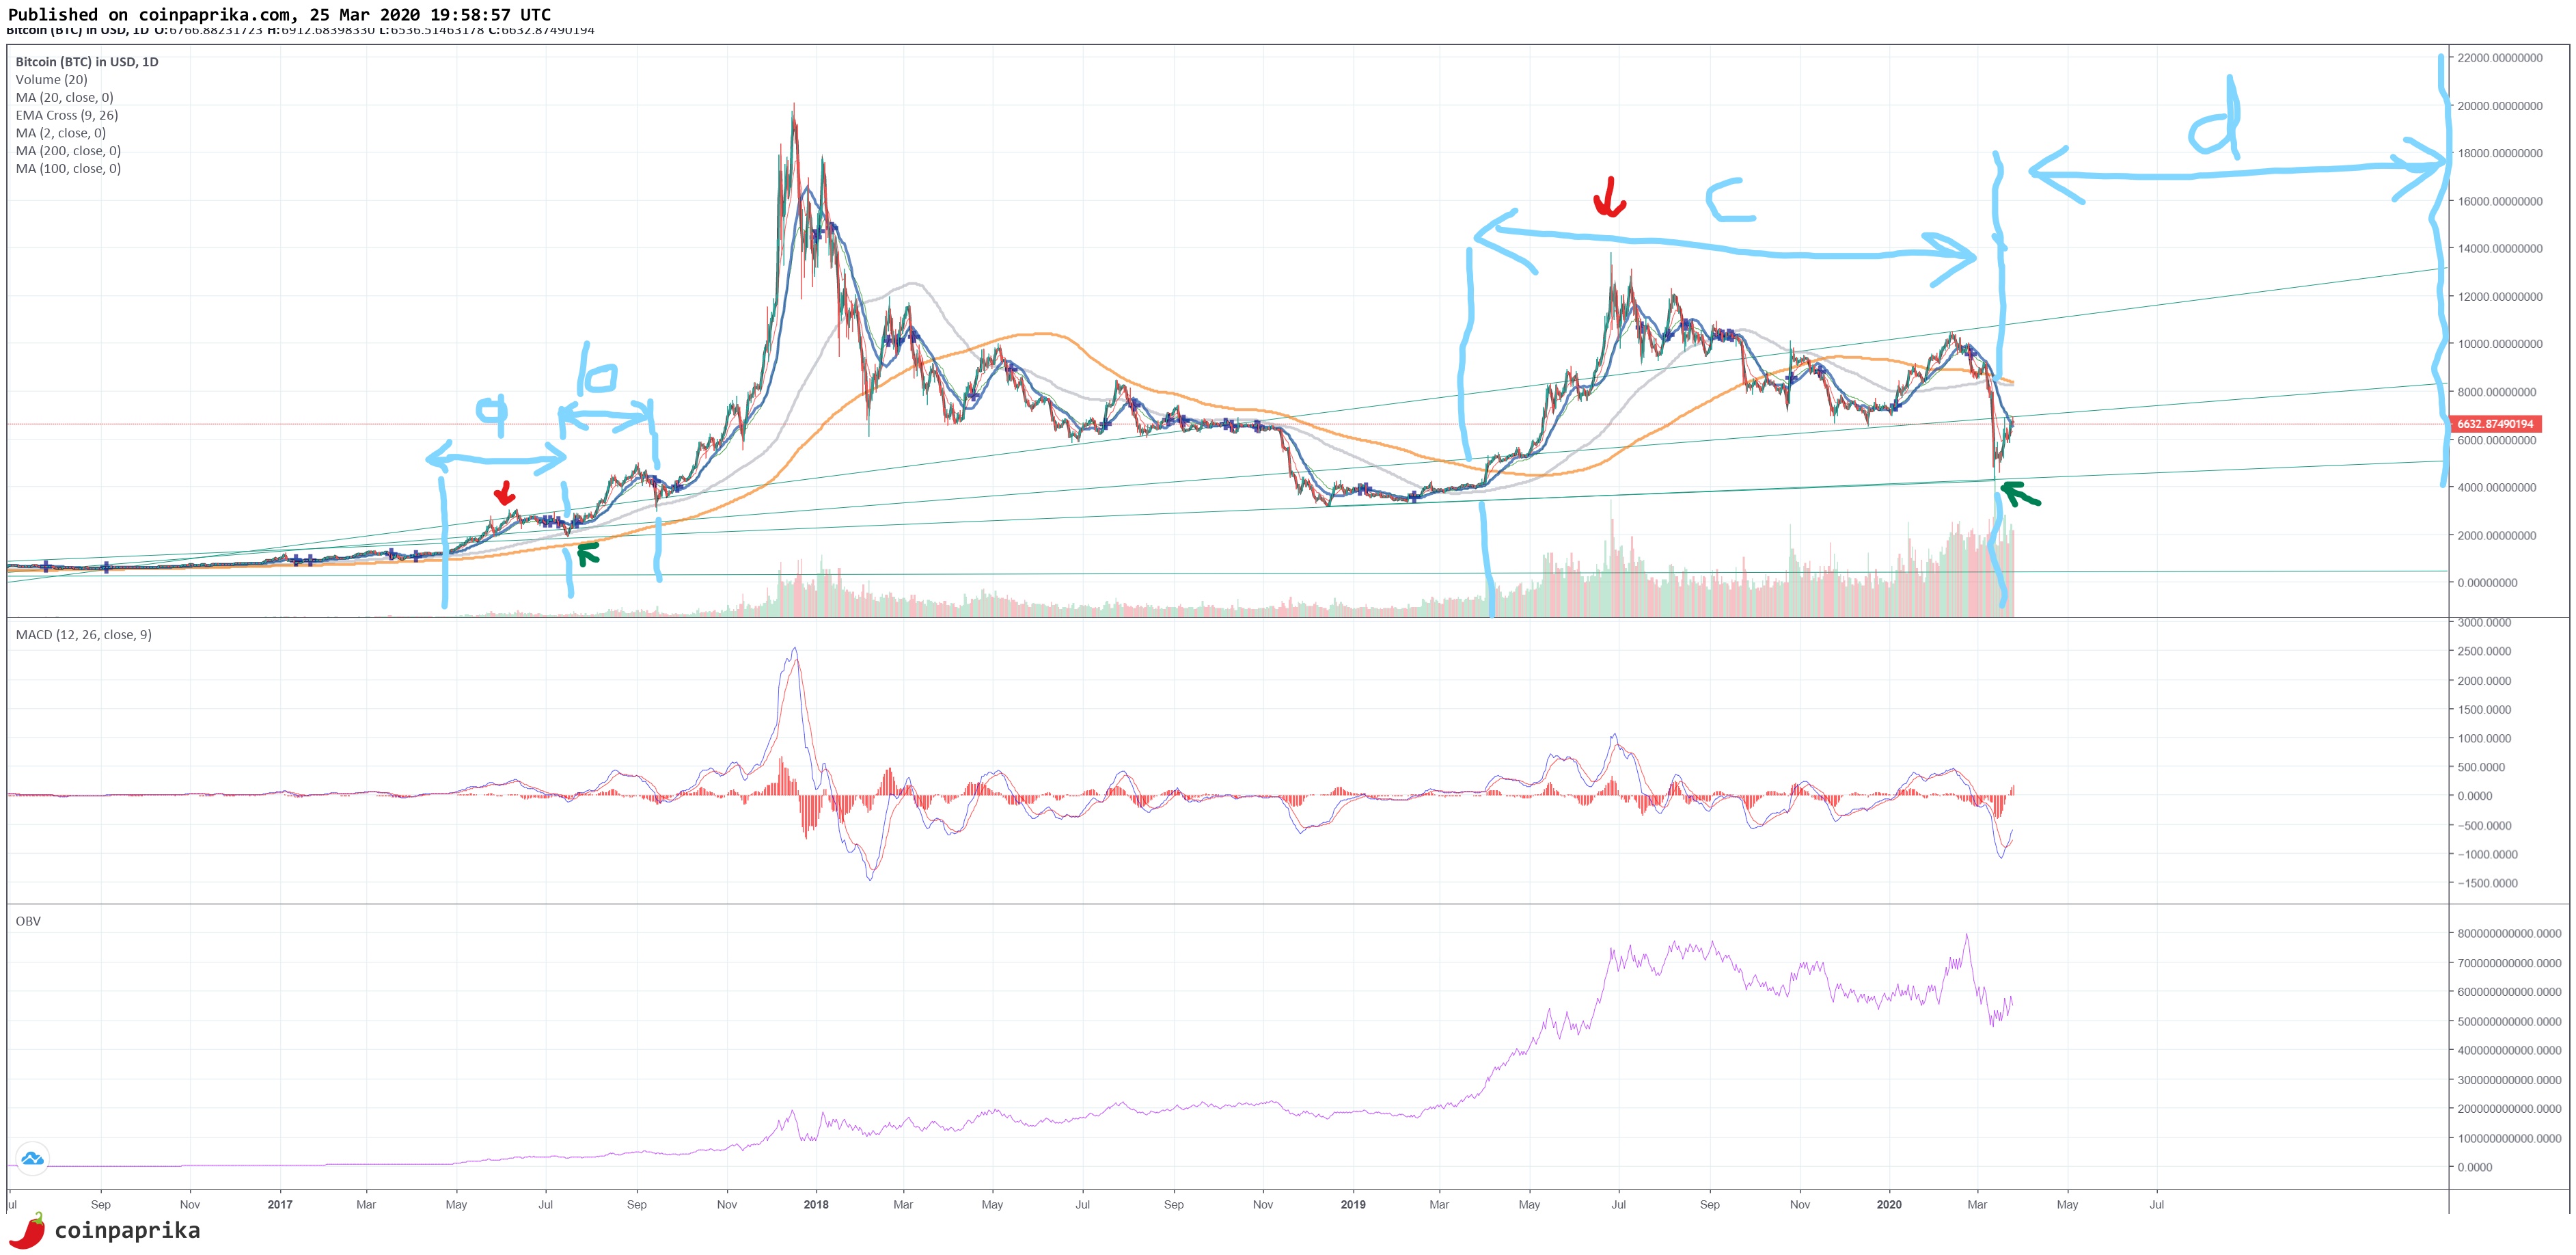
To explain it as possible as i can. At period (a) we see a selling point(red pointer) were BTC startet to drop. At the point were (a) period and (b)period come in touch there is a buy point(green arrow). (a) and (b) look almost the same patterns only that in period (b) the drop is a little faster at the end than in (a).
Because i didn’t get involved in this a said wait
 If i could extend the (a) period in a longer time it would be the same with (c ). In (c ) i have made a red pointer for the selling dip period and at the end before we go to (d) period we can actually see a buy point(green pointer). Period (a ) was about 70 days(red selling point in the middle on about 35 days). Period (b ) was about 60 days(red point at about 30 days). Period (c ) was about one year(365 days)(red point at about 90days). If History repeats itself but in longer periods then we will see a higher high than the 14k in about 100-150 days and the moon over the 20000 is a more longer run if the third phase starts with the pattern going like after period (b) and going the same after (d ) which is at the time i am writing this. Also i have put EMA Cross on 9 and 26 period and four MA 2,20,100,200. Also underneath is MACD and OBV.
1 Like
this is a very simple stategy:
buy if EMA(9) is rising and crosses over EMA(20) and price > EMA(50)
set stop loss at 97% of latest support level
trail stop loss at 97% of new support levels
I just want to look for little 2% bumps at a time with some “play” money. And hodl the main stash.
A relatively common pattern that I found which is a useful indicator of a trend change is the “head and shoulders” pattern.
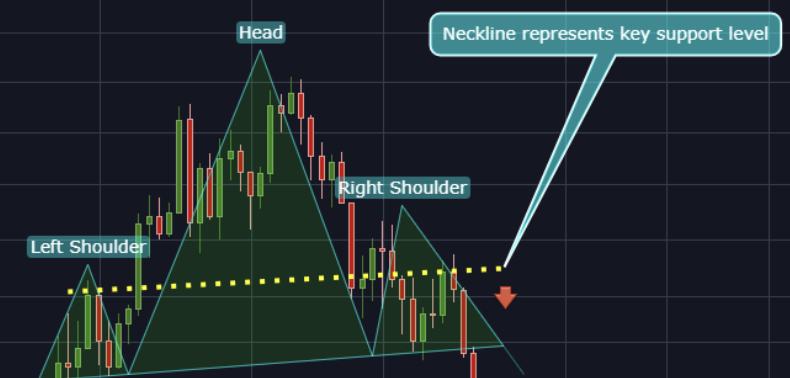
The illustration shows a clear trend change to the downside once the pattern has been completed and can be used to short. The best time frame for this pattern is 4hr-daily as these time frames provide stronger confirmation of trend change.