
Hi everyone,
I share a strategy (if I may call it this way) I was looking at recently. It is probably not so good as if I look at the price now it seems I had it wrong but at least I don’t try to hide it to look smart: BTCUSD chart, daily, last 6 months, looking at it on 13-april-2022. A few days before I looked at a trade line which was made using the previous lows on 24-jan and 24-feb.I was waiting for the price to bounce on this trend line to consider it a buy signal. It happened mid-april, went ok for a few days, but not long later the price crashed as you know currently. That was my strategy, losing one (at least in a mid-term) I concede. Another option, more conservative, was to wait for the ema 50 to go above the ema 200, it was getting closer at that time, but as of today it did not reach it. Anyway, I hope I answered to the question at least, to some extent.

Buy during the swing up and sell at the swing down, but for Crypto especially Bitcoin I just like to hodl.
I will describe a strategy that I have in mind these days and still didn’t test, so I don’t know how profitable might be. Let’s take the S&P 500 micro futures MES.
I take the Initial Balance, first hour of the trading session. If the initial balance has been compressed compared to the ATR of the last 10 sessions ( namely less than 25%), I would buy by market at the first breakout looking for an extension = 2* initial balance. I Would put my stop just below the low of the initial balance. The strategy applies also for the short side. I might insert filters like Vix or volume of the last minute candle before the breakout compared to the average of the last ten. Looking to hear from you and for some indication to improve this strategy. Happy trading to everyone.
6/24/22 - market (btc) breaks resistance after every 23-27 days of consolidation ,
tempted to 3x short btc or eth as we are 1 week into consolidation and reaching top of Bollinger bands as well as a 56 on the RSI
macro headwinds + bear market
NEAR/USDT, 1hr chart Binance, buy when MACD drops under -0.5, sell when MACD goes over 0.5
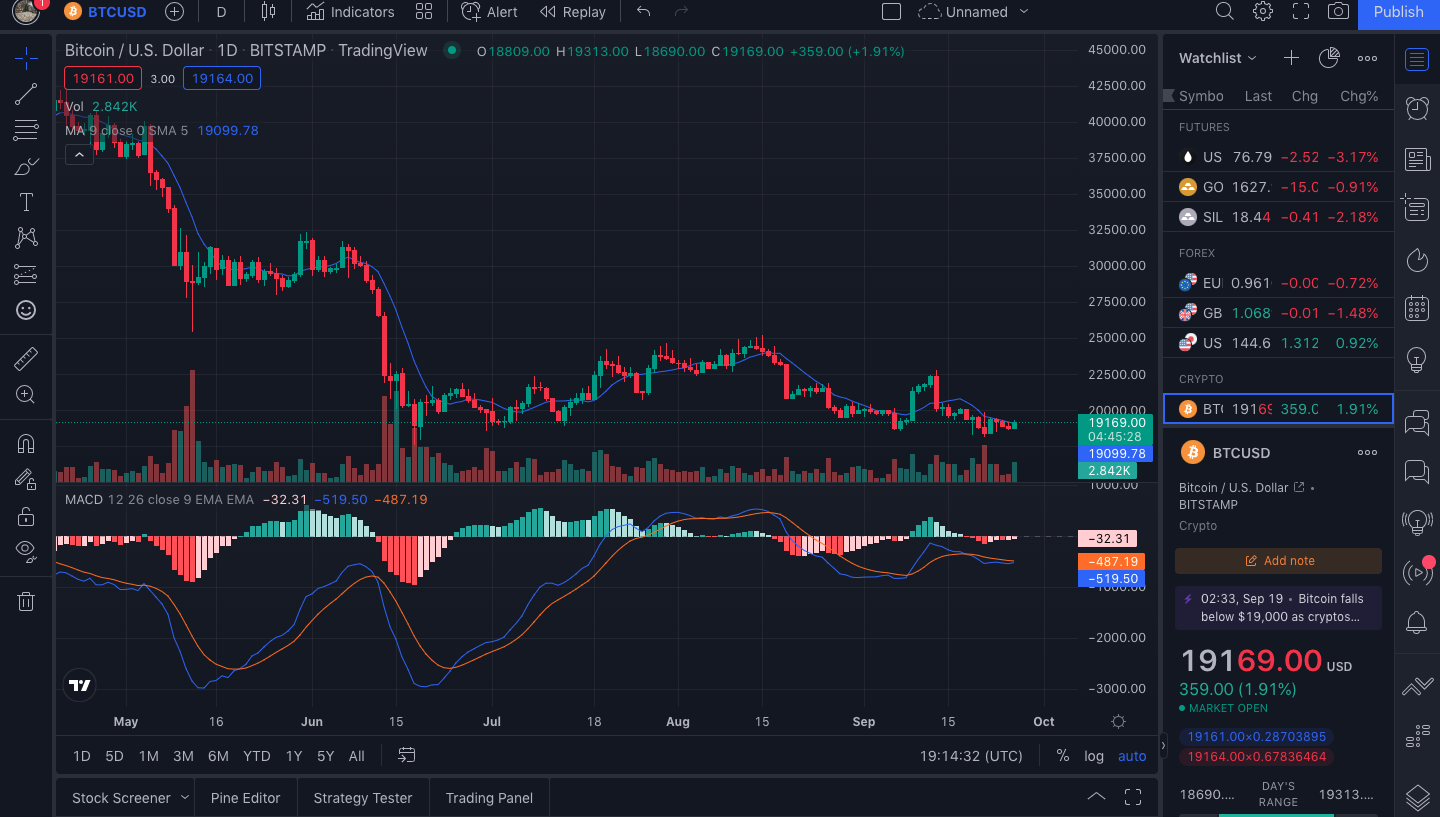
I think (at the time of writing), an opportunity of longing BTC could be presenting itself.
Due to the change in the Moving Average Convergence divergence (MACD). This indicator tends to predict a change in short trend. If we can see the picture bellow we may be in a short bull trend. (We can historically see that when the long line (Yellow line) crosses below the short line (Blue line) a positive price movement is observed.
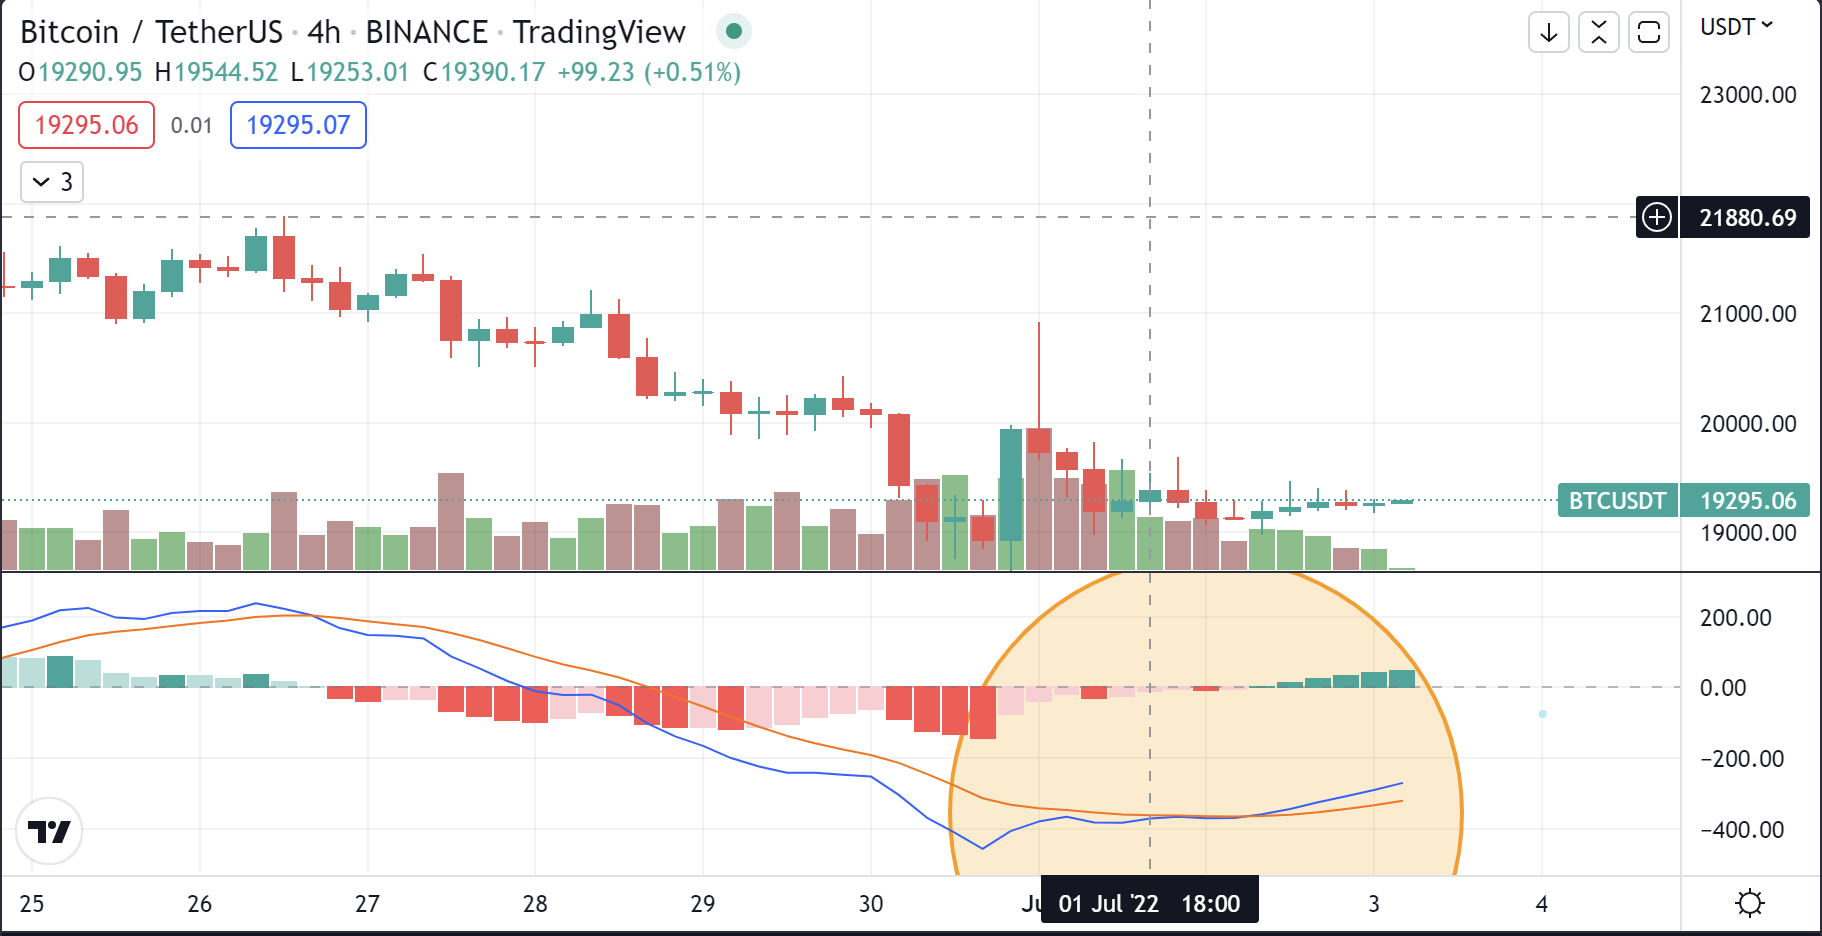
i was trying to understand divergences
but the pattern can be better seen with
- 4hr chart candlestick &
- Daily RSI stochastic {3, 3, 14, 14}
and i can follow up with
price making lower lows or higher highs in combination with
RSI stochastic
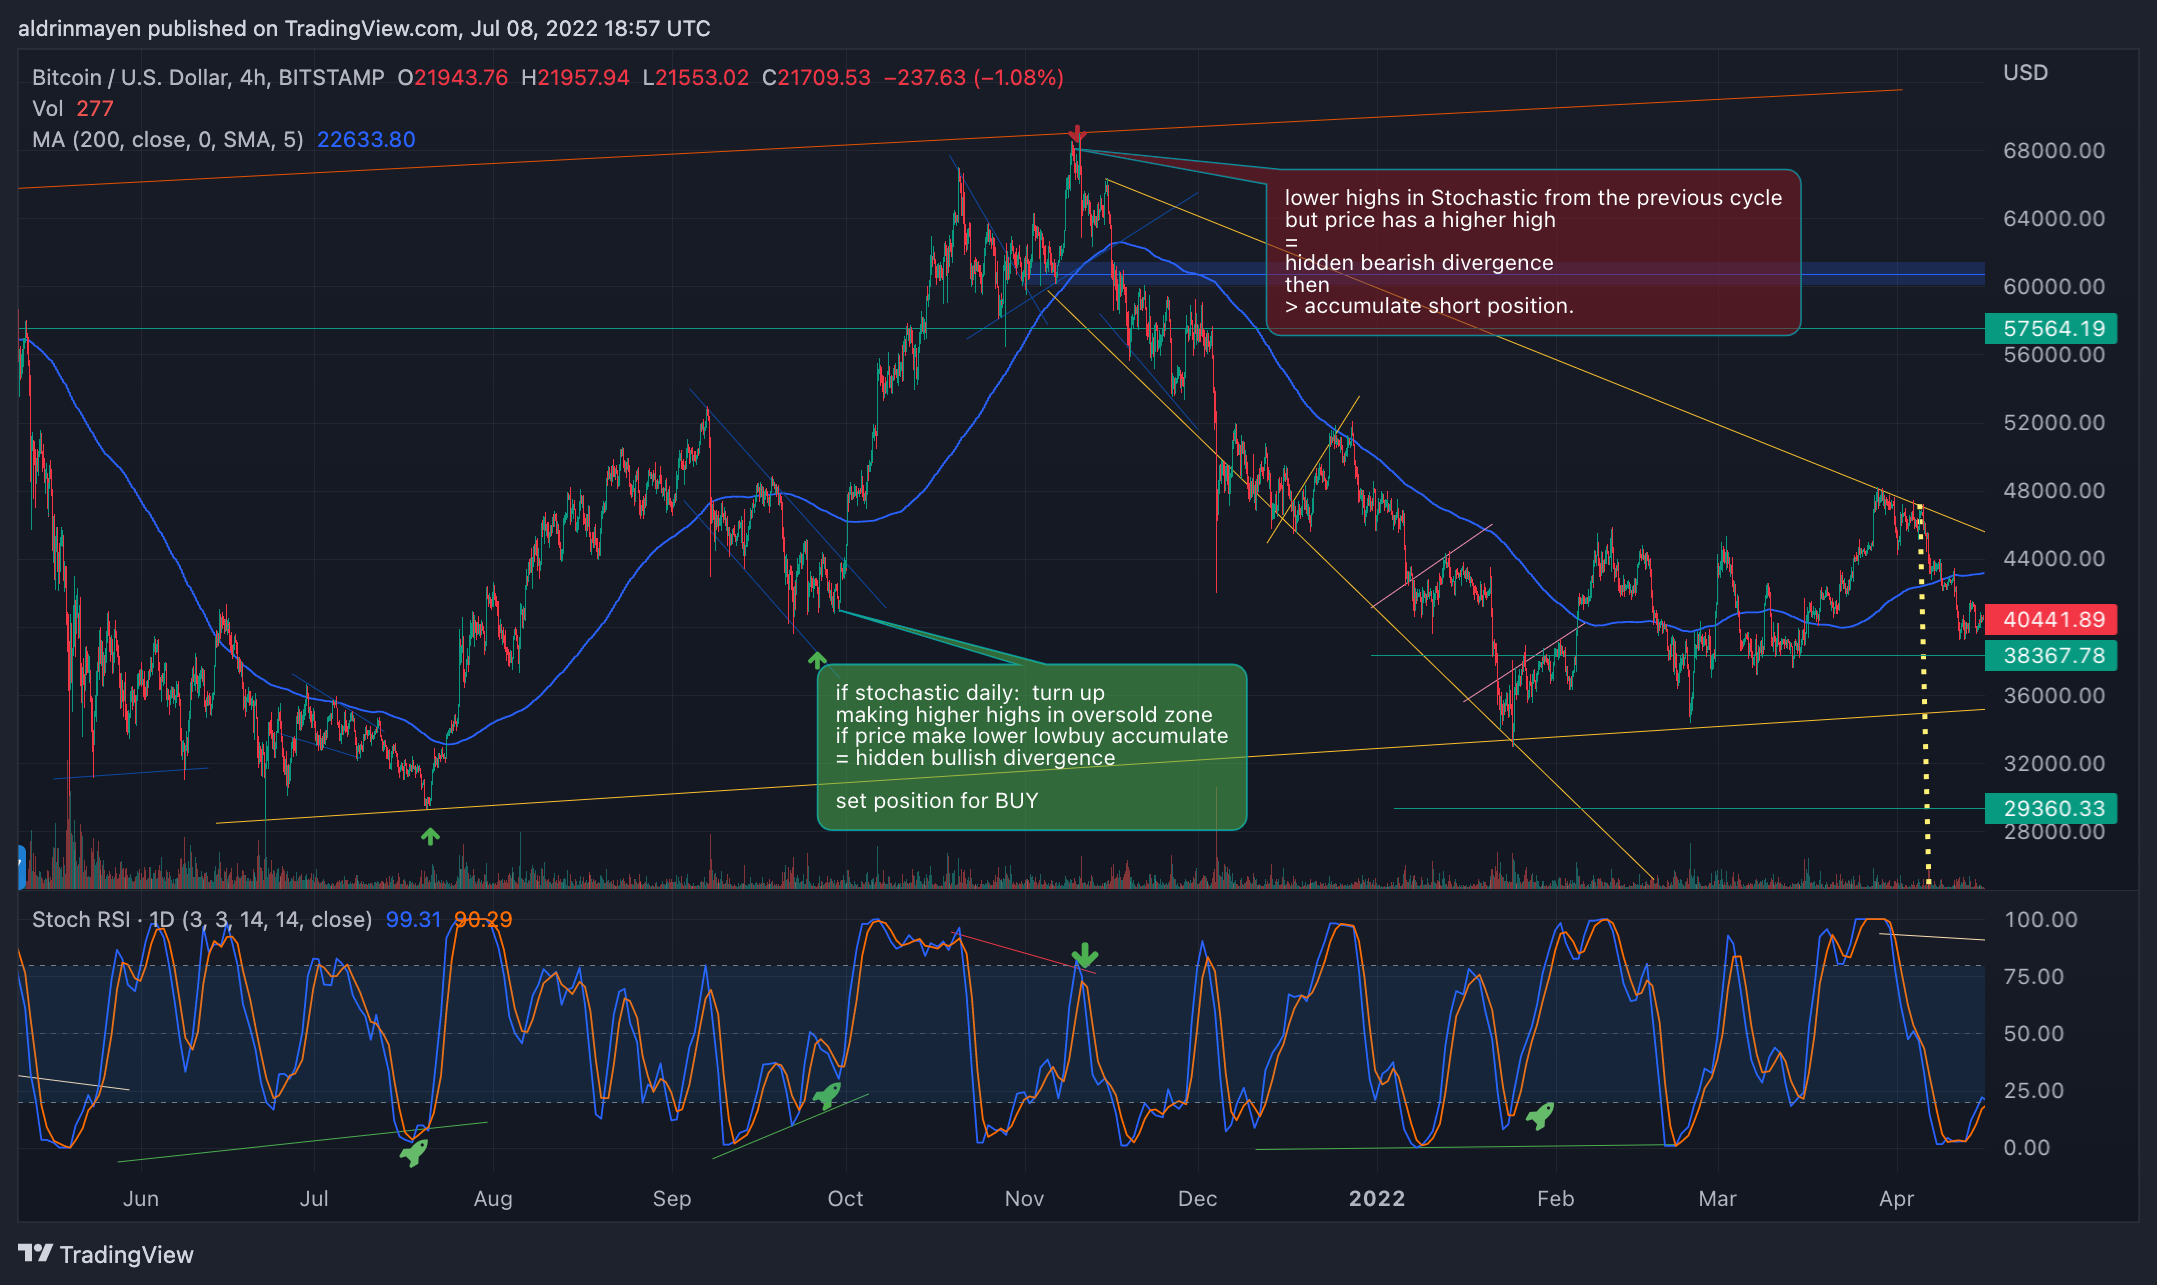
Sell/Short position:
lower highs in Stochastic from the previous cycle
but price has a higher high
=
hidden bearish divergence
then
> accumulate short position.
BUY/Long idea:
if stochastic daily: {turn up
making higher highs in oversold zone;}
&
if price make lower low
= hidden bullish divergence;
then buy to accumulate
set position for BUY ```buy as trend goes up sell as trend goes down, buying and selling at support and resistance levels
I started to learn this domain some weeks ago and am still new to it. However, I understood that it’s better to buy it when it has a lower rate and then sells a percentage of it when it’s up.
I am learning a lot of techniques on the platforms that Dough Roller promotes. The more platforms you use to inform yourself, the more accurate the results will be. I’ve noticed that you can’t get consistency in this area. So taking risks is the first thing you have to be willing to do. But it is the most enjoyable part of life, it is interesting, full of risk and happy moments.
My idea is to use the BBRSI strategy
Use an hourly 10 period BB (1 m TF Length 600)
When the price is above the upper band or below the lower band it stays there for some time.
Using the BB and divergence indicator:
-
When we have higher highs in price and lower highs on the same period of time on the oscillator - we have bearish divergence
-
When we have lower highs in price and higher highs on the same period of time on the oscillator - we have bullish divergence
My idea is:
On 1day time frame:
-
Buy when price breaks above EMA21 (or EMA50) and closes above
-
Sell when price breaks under EMA21 (or EMA50) and closes below.
My current strategy that I keep continuously back testing;
5 min time frame
2 EMA’s: RED: 26 length on 1hr, GREEN: 12 length on 1HR (For identifying trend)
Chandelier Exit/Entry indicator for Entry and Exit signals +
ZSLMA length 50 for confirming signals.
If green ema is above red, take longs only. If red ema is above green, short only. Chandelier exit provides the buy/sell signal, if the candle (on the signal) closes entirely above the ZSLMA (for longs) or entirely below the ZSLMA (for shorts), enter trade. Stop loss is previous low or high, ratio is 2:1. Take half trade out at 1:1, move stop loss to entry price, close entire position at 2:1.
Find a channel in the charts.
Long the bottom and short the topp of the channel.
Follow that trend until it is broken

Here’s a stab at my first attempt
- Assert a long term trend
- Using the MACD instrument assert if we are at a buy signal
- Execute an order to buy when the fast signal line crosses the slow line
- Execute an order to sell when the slow signal line crosses the fast line
The execution time frame would span days as that is the chart I’m currently focusing on.
Hi, my first take on this. be nice lol.
From what it looks like on the chart you look at the macd and well the market is obviously in a downhill trend. We all know that we will be losing around 70 - 90% of the market this year and were not done yet. imo what I do is, like everyone else would be not putting in orders for longing but rather shorting the market until we see some resistance and putting stop orders in to save from losses, so we can make money on the way down.
For Example by RSI:
Sell: when the RSI reaches 70.
Buy: when the RSI reaches 27.
An idea would be to draw support lines in an uptrend of BTC, on the daily chart. Then when price drops close to a support line, look for oversold situation on the RSI. Then look for a bullish hammer or bullish engulfing. That way, there are 3 indications in agreement.
Now put the SL 1.5 ATR20s below, and the take profit 3 ATR20s above entry.
buy at support levels and
sell at resistant levels
I’ve been in crypto for a while so I have a few. One idea is that large wicks usually get filled. So if a coin has been dead but suddenly has a huge influx of volume, then the flippers take advantage and drop the price back down, resulting in a large wick. I wait for this drop and buy in as it falls, then have a price target near the top of the wick.
Another idea I have is finding established NFT sets which have a large spread and low volume (and hopefully don’t have bots putting in offers already). Lots of times the holders will lose patience and want the ETH, so they’ll accept a lowball offer. Then I immediately relist at floor price. This isn’t exactly an original idea, but it’s been one of my most profitable strategies.
Last idea is to always zoom out. This is definitely not original, but it’s the best one. If there is ever a scary day in the markets, zooming out is the best way to regain perspective and eliminate emotions from trades. Suppressing emotions is a muscle that needs to be exercised, but after a few profitable trades it becomes easier to counter-trade the herd psychology.