Trading Assignment: Find an idea

My first strategy is a very simple one:

I want to trade on the two most ‘safe’ cryptocurrencies on the market: ETH/BTC pair
The strategy is going short (selling ETH to BTC) every time the RSI(14) > 75 on the daily timeframe candles and going long (selling BTC to ETH) every time the RSI(14) < 40

1 Like

Looking at BTC 1hr candle chart on 12/9/2021, 3:29 pm EST

Although RSI is giving me a sign to long but MACD isn’t telling me to long yet. I am not going to open a position at this moment unless i get a clear signal to long.

RSI Strategy:

RSI is 25.5 which is below 30. Its a good time to long BTC. Although there’s is a chance it could go further down but seems like a good bet to long from here.

MACD Strategy:

On the other hand, looking at the MACD chart, Its telling me the histogram is on the negative side, so still in bearish trend so i would probably wait a bit to long. MACD Line is also below zero.

1 Like

Watch for pinching triangles.

So in a bullish trend, have a horizontal resistance level, and if price is getting pinched, put a long position on the downward trending line.

Then if it goes to hit the roof, dynamically change the stop loss to be at the entry-level (max loss = 0).
And then if it breaks resistance, dynamically move both take profit and the stop loss depending on ratio, as prices tend to have large pumps right after breakouts… And if it eventuates to be a fakeout, you’ve had an increased stop-loss, so you’ll be at worst take profit.

1 Like

On the 15m time frame (BTC/USDT) ; Each time the price is below the 21hr EMA and the MACD-line is crossing the signal line while they are both going up you can open a long with the target on the EMA.

1 Like

Use ADX DI to follow the trend, if ADX above 25 and DI+ above DI- and MACD above 0, then go long, else if ADX above 25 and DI+ below DI- and MACD below 0 then go short.

1 Like

Identify a flag, then buy then within a certain range of the horizontal line and sell when within range of the trend line. Of course this is for the downward slanted flag, otherwise do the reverse. Perhaps set a stop loss when crossing the horizontal line.

1 Like

Simple Strategy using the BTC support of £30,000. Set a limit order at say £30,200 and take profit at £37,000 which is just under the resistance (orange line). Set a stop loss under £30,000 support, continue to use this strategy trading within the channel until there is a break.

1 Like

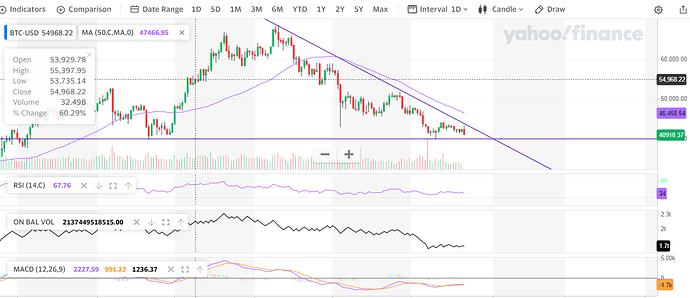
My first real attemt of placing technical analysis on the BTC chart, hope this is correct. :sweat_smile:
The trend seems to be going towards the end of the triangle and if we break at the top we should be going up, if it breaks support it might go down.
But if we also look at the RSI value which has been sitting around 30 for a while now, It seems like we are due for a bounce.
The MACD lines are almost crossing eachother too which is a sign to put in a position.

No financial advice, just speculation and homework, dyor :slight_smile:

2 Likes

So far I understand that you should buy at the support level and sell at the resistance level while the market is bullish.

2 Likes

Looking on the BTC chart on H4 timeframe for divergences, hidden, bullish or bearish. Combine the divergence with a Stochastic cross up or down, above 20 and bellow 80. After a downtrend, if a positive divergence is occurring, and is combined with a double bottom or W formation, this can be a good sign for a buy.

2 Likes

Today is feb. 19 2022, BTC is at 39986.90 USD.
My only idea is to DCA and hodl…

1 Like

My idea is a bit of a long-term project that pieces together a separate project I’m working towards that deals with AI. I have lots of research and work ahead of me to accomplish this.

My idea is this:

Phase 1

Buidl a platform that allows me to pick which cryptocurrency I want to watch, and have an AI chatbot analyze the chart(s) and notify me of all found buy/sell signals/patterns that we’ve been discussing;

Phase 2

When the AI assistant finds and notifies me of signals for each chart, I want it to suggest possible options (buy, sell, hold, setup a resistance/support line to notify me when it gets close/passes the line, etc);

Phase 3

Have my AI assistant use Twitter to find sentiments for the chosen coin(s) and map the overall human sentiments along the graphs; I’ll use this to observe how the chart(s) behave, based on how the coin(s) are being discussed on Twitter.

This phase will be rather large, as I’ll first need to research what I can do with Twitter API’s, buidl my AI to interact with the AI, provide the accounts, tags, etc for the bot to watch/collect sentiment data from in Twitter (with the future being the AI attempting to find the data on it’s own and I’ll review/edit the data it’s going to monitor), and then find a way to graph that along the chart(s).

Phase 4

Do actual trading based on what I’ve been observing/testing in above phases; this phase will be implementing what I’ve learned, and (hopefully) have data to support making my decisions on when I’ll buy/sell. In the previous phases I’m hoping to do “fake trading” to see how well everything works based on making decisions from the data collected. If I’m able to, I want to make this closely resemble a game where I’m ultimately just managing resources (fiat and crypto), and if things have been going well, I’ll toggle it to use real fiat.

1 Like

I will develop a DCA formula that calculates the number of shares to purchase based on a starting price, the initial amount of btc eth or any other coin bought . the formula will give me the price to sell or buy at depending on the trend of the price. sell as it goes up buy as it goes down and the number of coins to buy after every completed TRX, Tweaking of system will happen in the testing phase

1 Like

I don’t know if this is possible. I want to swing trade positions by converging RSI, Stochastic RSI, and MFI to make an oscillator. From that oscillator, I should be able to determine good buy zones and sell zones. Then id like to do the same across all “important” short and long term timeframes. If a buy signal shows up on multiple timeframes simultaneously, I’ll know it’s a strong buy, same with sell signals. I will fit the requirement so it can hopefully be profitable in an uptrend, downtrend, or while in a zone. If I weigh the RSI heavier than the SRSI and MFI then perhaps I could make a moving average through the oscillator where I could then provide the bot with if/then’s. (this should be fun to look back at once this course is finished)

1 Like

BTC/USDC - coinbase chart
1 HOUR CHART
Bollinger Band LENGTH 600 to adapt to 1min chart
REGULAR DIVERGENCE INDICATOR

STRATEGY; When price is outside of the Bollinger band and the Divergence indicator is indicating Divergence (RSI > 70 or < 30) there will be a higher probability of a change back to the meme, a trade would be entered with a stop loss of previous low candle and a take profit below meme.
RSI > 70 trade short
RSI < 30 trade long
This was strategy no.2 on technical analysis course, if its any help to anyone,

1 Like

My first attempt at this…

Using ETH/USD
30 minute chart
5 day moving average
buy as the price hits the moving average from below, sell when the price starts moving back towards the moving average

1 Like

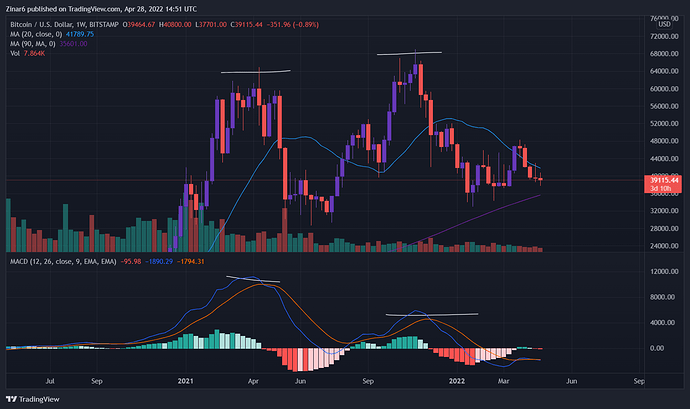
At the top of the recent bitcoin halving, the price makes a higher high but the MACD failed to make a higher and crosses over to the downside.

What if I can use this method and use it as a buy signal after price falls. Use this same method to trade for profit in an upwards trend with lots of volatility.

2 Likes

I am not sure how to program it. i would try to program the correlation between the dxy and bitcoin. when the dxy drops i would long bitcoin but on the weekly longterm. today is a good example. the dxy looks to be peaking out now or in the near future. i would wait for bitcoin to dip which i believe it will before going up. then i would use a larger stop loss since there could be a long squeeze. but i would have it not sell for a while since this run up could be long term. 2x is defiently in the cards if history repeats itself.

1 Like

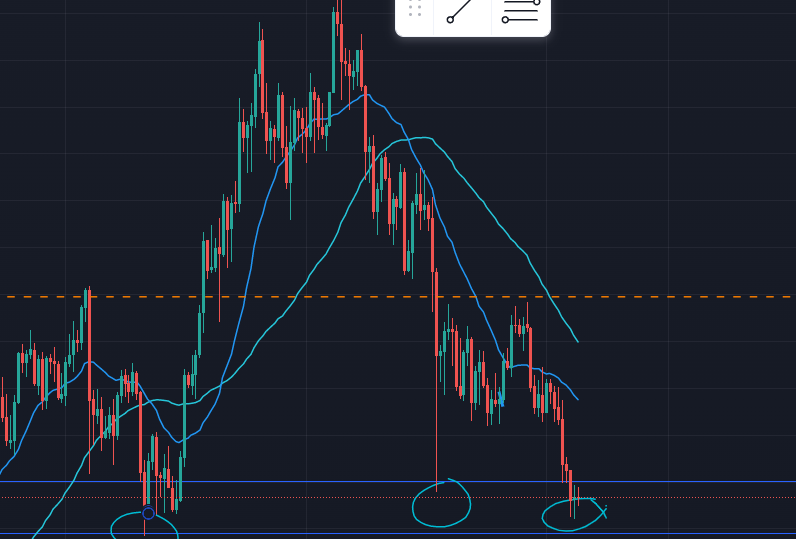
My idea in crypto is getting better investments that in tradicional markets. Right now I’m deploying money, because we are already in a downtrend of 6 months and BTC had created a strong support in the 38K, so I’m waiting for a break of that support to make a lower low and start a upside trend. Lots of the ALTS have suffered a lot with this downtrend and my idea is to put some money in ALTS, put them in staking for 30 days and take profit in every 25% increase. Recover the invested money and keep some for the future.
Its a simple idea but till knowing better the market is what I feel confortable to do.

1 Like

Buy when RSI prints a low and Sell when the RSI prints an high. Trading will be done on the daily chart and high = RSI > 70 and low = RSI < 30

3 Likes