My idea: For Cardano (ADA) if MACD blue line crosses above the red AND if RSI is above 50 and rising, then buy ADA:


My idea: For Cardano (ADA) if MACD blue line crosses above the red AND if RSI is above 50 and rising, then buy ADA:

I call mine the pyramid scheme, as shown in the attached photo
One idea is to look at MACD and RSI in combination and execute buy in up trend when RSI dips below 50.
Another idea is to watch for divergence between price and OBV and trade based on what OBV is doing.
Final idea is to play around with MAs at different time periods and execute based on price in relations to the MAs.
Potentially, use all three together.
My idea is to buy when there is a golden cross which is when the 50 day moving average crosses over the 200 day moving average.
I would use MACD indicator along with EMA set to 100 and if its trading above the 100 I will go long when the MACD line crosses above the signal line. I will also draw out the major support and resistance to pinpoint the stop loss.
One idea is using Boilenger bands in uptrend. When price touch lower boilenger band you open a long position and close it when price touching upper boilenger band.
To create a portfolio of 10 coins. 7 coins would be for hodling for long term. 3 altcoins traded daily and aim to reach 5% a day. Focus always on the low entry points and using the limit sell option with the wanted price. Using MACD, RSI, Volume indicators for signals. You would have 6-7 altcoins on your radar to choose the 3 altcoins for your portfolio and follow the trend.
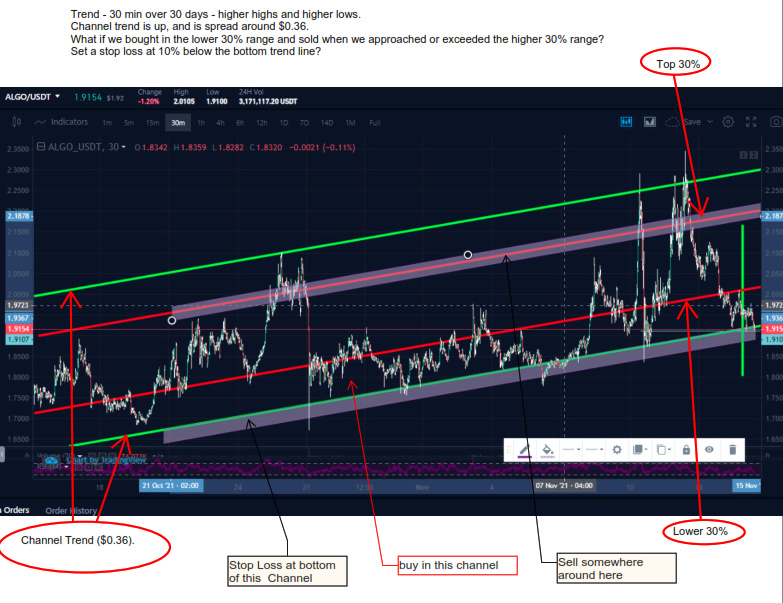
It is Oct 3. I see there has been a series of Bart Simpson patterns that is getting smaller and smaller. This, along with the triangle that is forming, looks like there is an up trend forming. Volume is low right now, might not be the best time for entry. However, I would place a stop lost at 44426 and start taking profit at 52.
I got stuck on this assignment for quite a while, not finding anything that seemed feasible. I have been watching tons of youtube videos with strategies now and finally found one I want to try that have simple rules and should be possible to automate.
The idea is to only use the kumo cloud part (lead 1 & 2) of the Ichimoku clouds and setting displacement value to 1, for long trades on daily timeframe. The entry signal is when a green candle closes above the clouds, while the green line is above the red line. The exit signal is when a red candle closes below the green line.
I would say if a price is ranging from sometimes on the 1h chart and the 20MA suddenly starts crossing the 50MA and the 100MA is a signal to open a long. Can be confirmed with the RSI and the MACD.
My idea is more of a positional long term idea which is to buy BTC/Altcoins when the weekly RSI is below 30 and sell 60% of my holdings when RSI line crossed below 70. I will let the remaining 40% (followed by a trailing stop right below the previous lower high in the market structure)still remain in case it moves further up until I See a Divergence , if I see a Divergence then I sell the remaining 40% and take a short position with the 20% of my profits, I will keep taking 20% profits on the test of every market structure followed by trail stops above the previous market on the downward trend also.
My trade idea is to add to an open long position when a price has a pullback to a certain support level, which coincides with a 100MA.
Time for the first Trading Assignment of this course. This time I want you to take a look at a crypto chart and try to find a trading idea. And just like I shared mine in the video, I want you to share yours in this forum thread.
I understand that this assignment can be difficult, but try your best. It doesn’t matter if the idea is good or bad, profitable or not - the point is to find SOMETHING.
A.
From the learnings on the moving averages and trend lines, I spotted a pattern (probably common between experienced traders) that shows that when in the Bitcoin chart the MACD indicators lines crosses, either on an uptrend or down, the kind of the same pattern it’s shown on the RSI. This has given me the idea that when the RSI is below 30 (actually closer to the 20 on the 4hr chart), and the MACD lines cross, that that actually is a strong buying signal. I would wait for confirmation before entering a long position.
I look on small frame times such as 30 minutes 1 hours and 4 hours and look for a divergence on the RSI

During the consolidation phases it should be possible to trade with support and resistances. Cryptos always needs time for their next break out and i think its not the worst strategie to make use of it.
// Tradin Idea
 1D
1Dupon.(candle closes){
if (price increased by at least 1%){
sell a matching percentage of holdings rounded to nearest 1% increment;
/* 1.4% price increase == sell 1% of current MATIC holdings
7.6% price increase == sell 8% of current MATIC holdings */
}else if (price decreased by at least 1%){
use half of the matching percentage of profits to buy more MATIC rounded
to nearest 1% increment;
/* 1% price decrease == spend .5% of current profit to buy MATIC
8% price decrease == spend 4% of current profit to buy MATIC */
}else{
no trades;
};
};
note: I feel vulnerable sharin an idea I haven’t fully thought thru yet. 
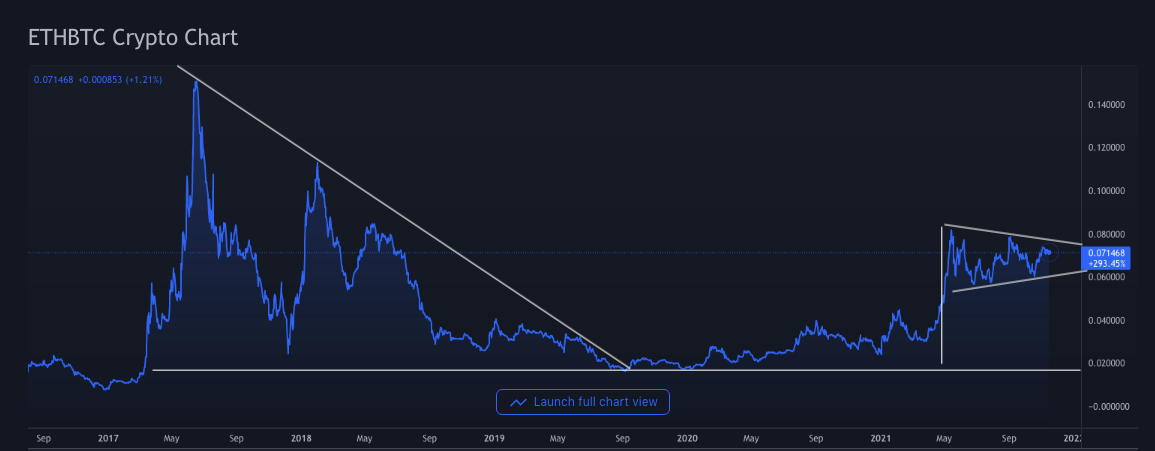
what i get from this chart is that ETH is about to get a leg up on BTC in terms of trading value; the 90% drop from a few years ago (when all the ICO hype was the thing) didn’t get below .02 (which i’d consider an absolute floor unless something crazy happened like the whole network was hacked or whatever), and since then it’s been trending upward with a recent bull flag(?) this year that looks like it might form a wedge that resolves summer of '22… price target somewhere between .09 - .15 unless it really blasts through .08 quickly, i.e. maybe up to .3 or 4 if it’s a real catalyst that shows eth is becoming commonplace (e.g. the gamestop market hype??)
…i’m more in eth than btc certainly!
My current idea is to isolate a half dozen of my favorite cryptos with good long term fundamentals (I currently have a few dozen, need to narrow down) and flip between them.
When any coin/token has RSI > 70, sell into an alternate coin or multiple coins with RSI < 30.
As most tokens will rise and fall more or less together as influenced by BTC, I could sell whichever coins have the most positive percent change against the average of them, and buy the coins with the most negative percent change against the average.
This will need back-tested to see if there are any predictable patterns.
I have to give Eric Krown credit for this one (https://www.youtube.com/c/KrownsCryptoCave), and it may be too low frequency (and there are only 3 iterations to back test) but it goes like this:
Go long on BTC at the low of the cycle. This is predicted by taking a fib retracement of the weekly candle high (not the wick high) of the previous BTC cycle high (either open or close) to the previous cycle low. The next cycle low is predicted to be the 4.236 fib extension of the last cycle high to the last low.
Go short on BTC according to the pi cycle top indicator. So when the 111 day simple moving average crosses (in the upwards direction) two times the price of the 350 day simple moving average.
This strategy may also work better if used as a definition of whether we are in a bull or bear market and modifying another trend based, higher frequency stratergy appropriately.