

@filip hi Filip, my RSI code only allows for one active open position at a time. ie. RSI is < 32 and a long position is created. And then this position is closed when RSI > 68 occurs and a short position is created to replace the previous long position. I want to have a strategy where there can be multiple longs active if there are multiple RSI < 32 occurrences before an RSI > 68 occurs? Can you show me how to do this? thanks 
Hi there @filip i have been learning JS & C++ so ive been away from this course for around 3 months.
I have came back with what i thought would be more of a riskier approach to my low capital.
$1000 capitol.
0.3 brokarage fee
code is bellow.
i cant test the strategy because i dont have a pro license and im not intending to get one untill i know ill use it.
-
Question is for me. Can we trade on TRADING VIEW with our strategy ? does it work as an exchange where i can connect a wallet and be good to go?
-
Second questions is can this Pine Code be used in other exchanges?
-
Going in to the real world with this is it simply betting on the future MA this strategy?
Here is my code any way. Please feel free to slate it.
// © Rob_mccourt

//@version=4
strategy("My Strategy", overlay=true)

longCondition = crossover(sma(close, 30), sma(close, 60))
if (longCondition)
    strategy.entry("0.00291200", strategy.long)

shortCondition = crossunder(sma(close, 30), sma(close, 60))
if (shortCondition)
    strategy.entry("0.00291200", strategy.short)
Hi Filip
For the last two years I have been working on a Crypto Strategy. I used the Open Source Python software Backtrader, connect to CryptoCompare to pull data, store the results in a MySQL Lite DB and run a Back Test the includes 80+ Cryptos pulling the max data for each crypto. IE for Bitcoin the starts at 2010-07-18. For some of the other currencies it is only a couple of years. Here are some of the numbers - The strategy entered 708 trades, Average win/loss per trade is 16%. Average win per trade 91%. Average Loss per trade 31%. Wins 39% of the time. I purchased the Academy to learn Blockchain. Did not expect to find this course. So far the material has been very good. I had not considered using trading view for testing a strategy. Very cool!
2 Likes
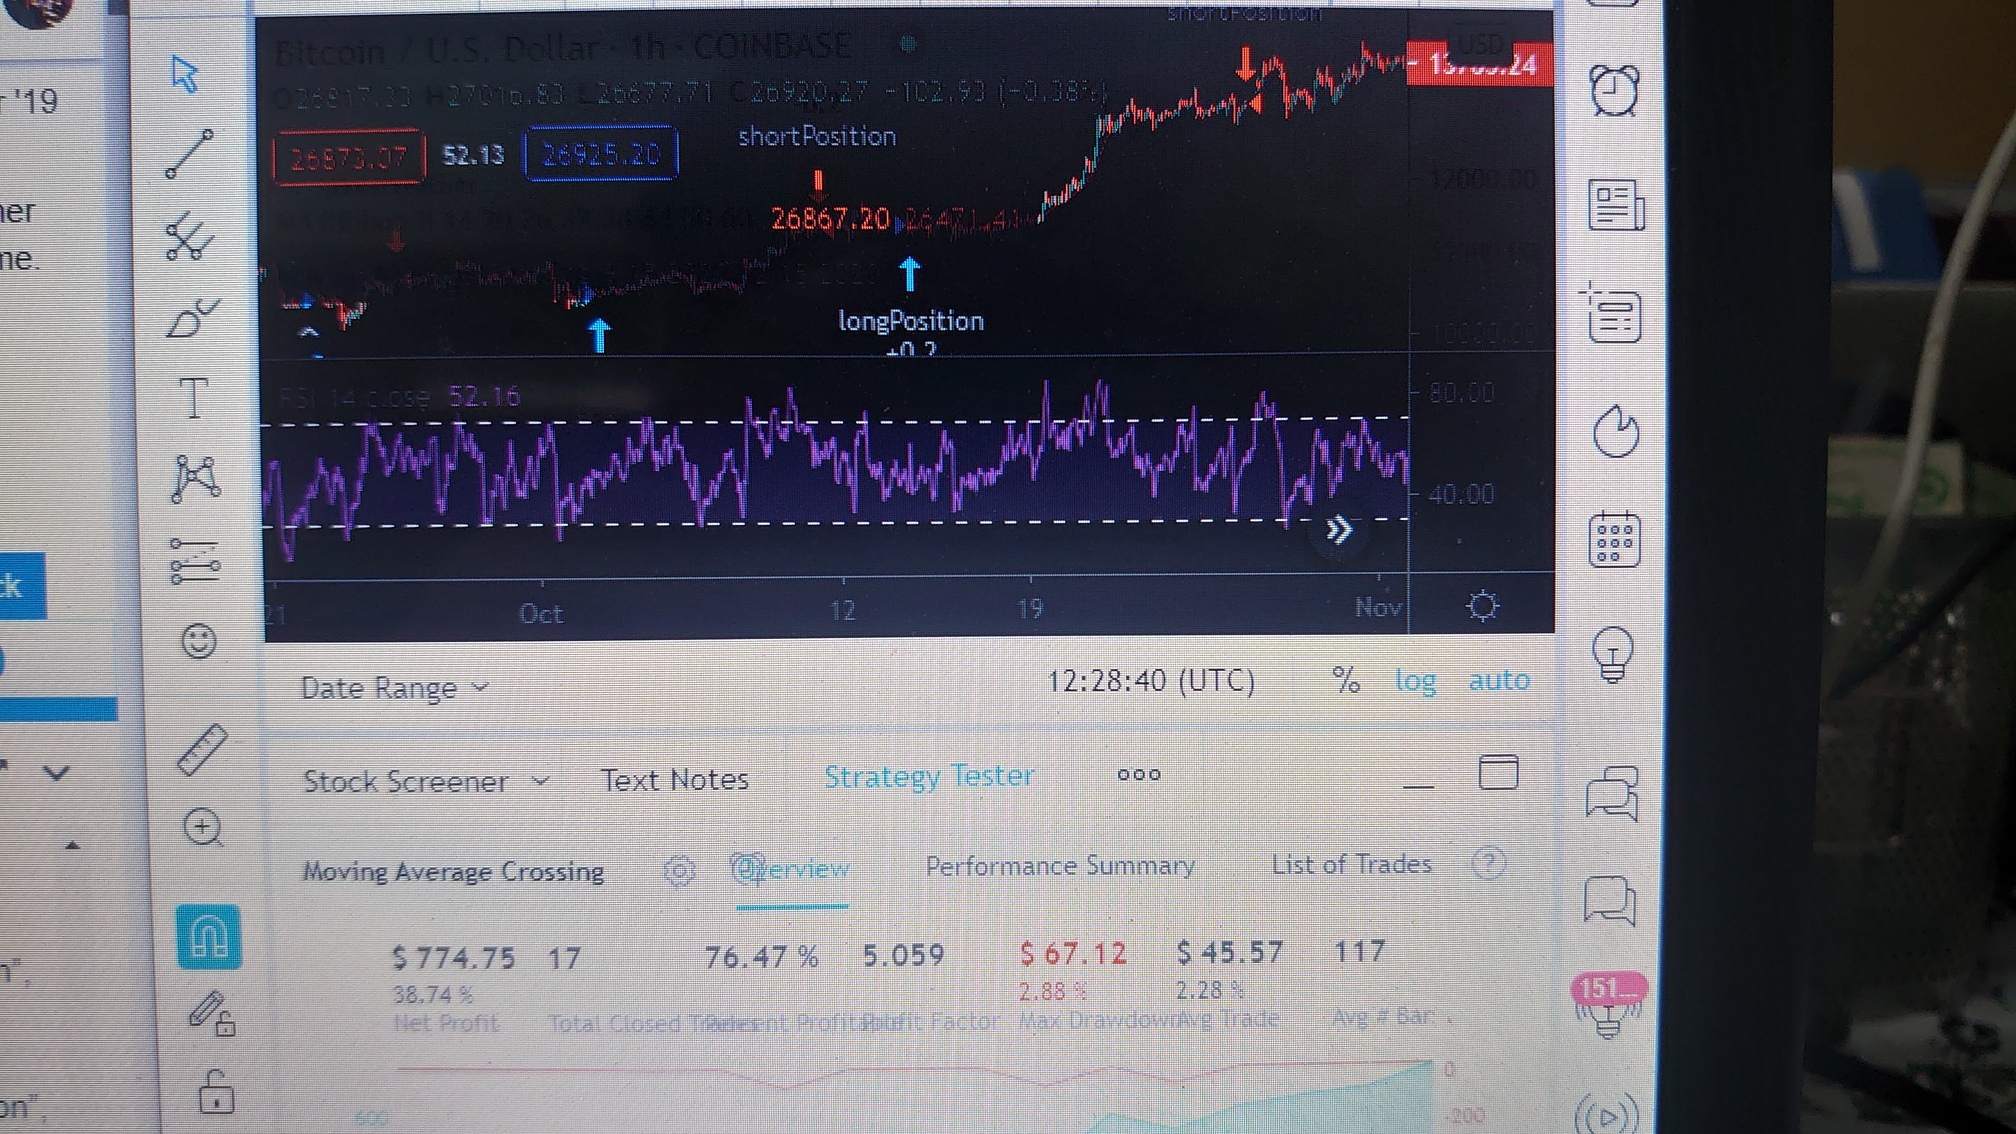
Still have to work on it, at least the strategy could show profit at long term (200 days).
// This source code is subject to the terms of the Mozilla Public License 2.0 at https://mozilla.org/MPL/2.0/
// © thecilsurf

//@version=4
strategy(title="Moving Average Crossing", overlay=true, initial_capital=2000, commission_type=strategy.commission.percent, commission_value=0.2)
//DATE & TIME
fromMonth = input(defval=1, title="From month", minval=1)
fromDay = input(defval=1, title="From day", minval=1)
fromYear = input(defval=2019, title="From year", minval=2014)
toMonth = input(defval=1, title="To month", minval=1)
toDay = input(defval=1, title="To day", minval=1)
toYear = input(defval=2025, title="To year", minval=2014)

//DEFINITIONS
shortMa = sma(close, 50)
longMa = sma(close, 200)
longCross = crossover(shortMa, longMa)
shortCross = crossover(longMa, shortMa)

// Get RSI input
rsiSource = input(title="RSI Source", type=input.source, defval=close)
rsiLength = input(title="RSI Length", type=input.integer, defval=14)
rsiOverbought = input(title="RSI Overbought Level", type=input.integer, defval=80)
rsiOversold = input(title="RSI Oversold Level", type=input.integer, defval=20)
// Get RSI value
rsiValue = rsi(rsiSource, rsiLength)
isRsiOB = rsiValue >= rsiOverbought
isRsiOS = rsiValue <= rsiOversold

//LOGIC
timeInRange = (time > timestamp(fromYear, fromMonth, fromDay, 00, 00)) and (time < timestamp(toYear, toMonth, toDay, 23, 59))
longSignal = longCross and timeInRange and rsiValue < 68
shortSignal = shortCross and timeInRange and rsiValue > 15

//CHART DRAW
plot(shortMa, color=color.orange)
plot(longMa, color=color.green)
plotshape(isRsiOB, title="Overbought", location=location.abovebar, color=color.red, transp=0, style=shape.triangledown, text="OB")
plotshape(isRsiOS, title="Oversold", location=location.belowbar, color=color.green, transp=0, style=shape.triangleup, text="OS")

//POSITIONS
strategy.entry(id="longPosition", long=true, qty=0.2, when=longSignal)
strategy.entry(id="shortPosition", long=false, qty=0.1, when=shortSignal)
1 Like
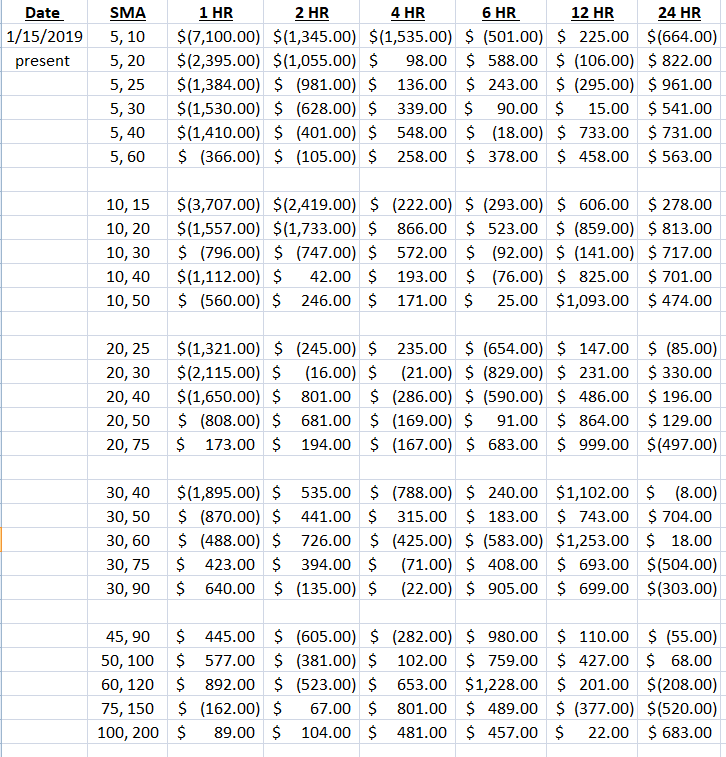
Came up with these results after running multiple moving avgs.
Code I used is the following; tried to use with RSI and MACD to pinpoint signals, but it just didn’t work out as good as using only the M.A.
strategy(title=“MA Calls”, overlay=true, initial_capital=2000, commission_type=strategy.commission.percent, commission_value=0.2)
//DATE AND TIME
fromMonth = input(defval=7, title=“From Month”, minval=1)
fromDay = input(defval=15, title=“From Day”, minval=1)
fromYear = input(defval=2017, title=“From Year”, minval=2014)
toMonth = input(defval=12, title=“From Month”, minval=1)
toDay = input(defval=15, title=“From Day”, minval=1)
toYear = input(defval=2018, title=“From Year”, minval=2014)
// Getting inputs
fast_length = input(title=“Fast Length”, type=input.integer, defval=12)
slow_length = input(title=“Slow Length”, type=input.integer, defval=26)
src = input(title=“Source”, type=input.source, defval=close)
signal_length = input(title=“Signal Smoothing”, type=input.integer, minval = 1, maxval = 50, defval = 9)
sma_source = input(title=“Simple MA(Oscillator)”, type=input.bool, defval=false)
sma_signal = input(title=“Simple MA(Signal Line)”, type=input.bool, defval=false)
// Calculating
fast_ma = sma_source ? sma(src, fast_length) : ema(src, fast_length)
slow_ma = sma_source ? sma(src, slow_length) : ema(src, slow_length)
//DEFINITIONS
shortMa = sma(close, 30)
longMa = sma(close, 60)
r = rsi(close, 14)
macd = fast_ma - slow_ma
signal = sma_signal ? sma(macd, signal_length) : ema(macd, signal_length)
//LOGIC
timeInRange = time > timestamp(fromYear, fromMonth, fromDay, 00, 00) and time < timestamp(toYear, toMonth, toDay, 23, 59)
longSignal = crossover(shortMa, longMa) and timeInRange
shortSignal = crossover(longMa, shortMa) and timeInRange
//POSITIONS
strategy.entry(id=“Long IT!”, long=true, qty=0.1, when=longSignal)
strategy.entry(id=“Short IT!”, long=false, qty=0.1, when=shortSignal)
1 Like
I also ran it against the trend from July 2017 - December 2018; just didn’t make a spread for it. Results were still acceptable
1 Like
Here is my code:
// © bratislavzivkovic

//@version=4
strategy(title = "My Strategy", overlay = true, initial_capital = 2000, commission_type = strategy.commission.percent, commission_value = 0.2)

//Date and Time
fromMonth = input(defval = 8, title = "From month", minval = 1)
fromDay = input(defval = 1, title = "From day", minval = 1)
fromYear = input(defval = 2020, title = "From year", minval = 2014)

toMonth = input(defval = 12, title = "To month", minval = 1)
toDay = input(defval = 1, title = "To day", minval = 1)
toYear = input(defval = 2020, title = "To year", minval = 2014)


//Definitions
shortMa = sma(close, 45)
longMa = sma(close, 60)
r = rsi(close, 21)


//Logic
timeInRange = (time > timestamp(fromYear, fromMonth, fromDay, 00, 00)) and (time < timestamp(toYear, toMonth, toDay, 23, 59))
longSignal = crossover(shortMa, longMa) and timeInRange and r > 50
shortSignal = crossover(longMa, shortMa) and timeInRange and r < 50

//Positions
strategy.entry(id = "longPosition", long = true, qty = 0.1, when = longSignal)
strategy.entry(id = "shortPosition", long = false, qty = 0.1, when = shortSignal)
First time range is from 01.08.2020 to 01.12.2020.
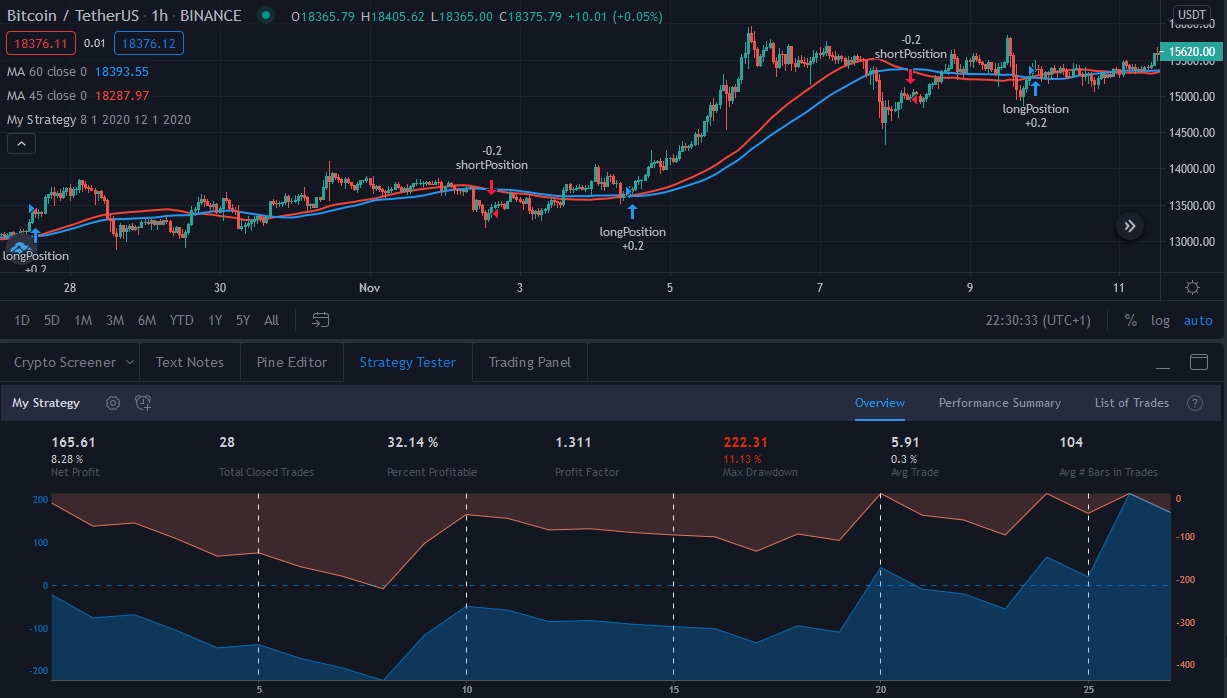
Second time range is from 01.04.2020 to 01.08.2020.
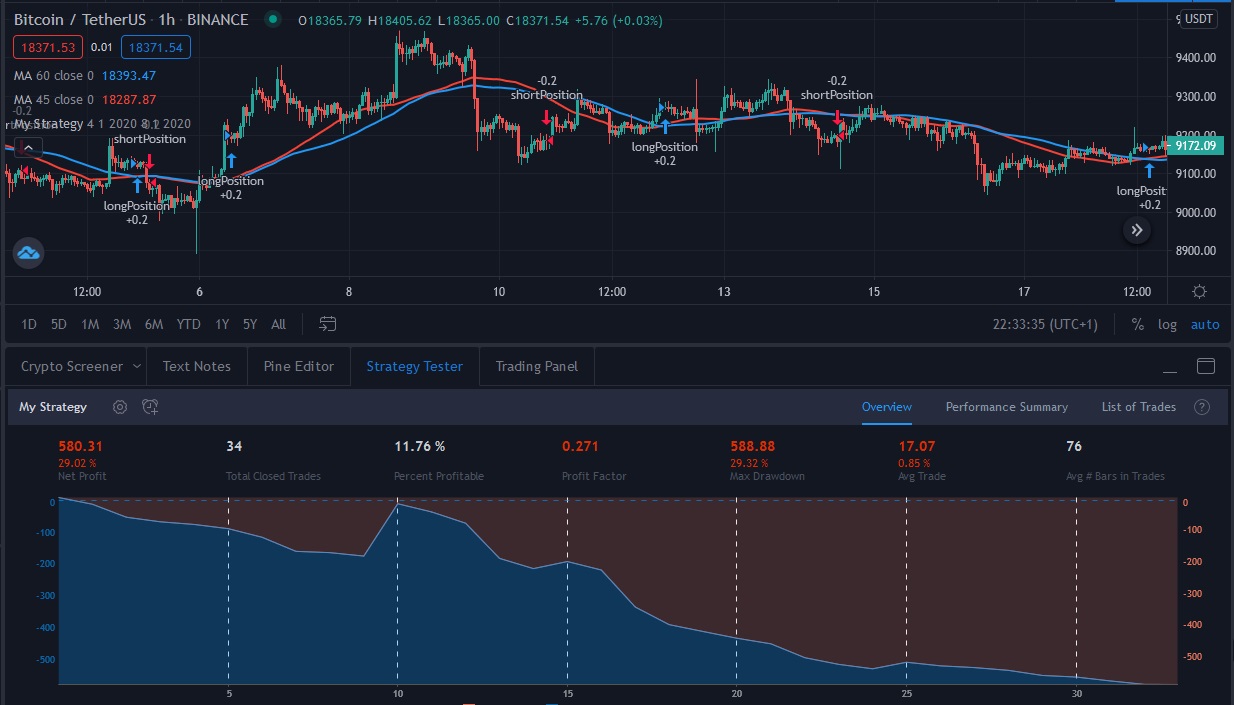
My strategy, although it looked good on the first data set, does not look good on the control data set.
1 Like
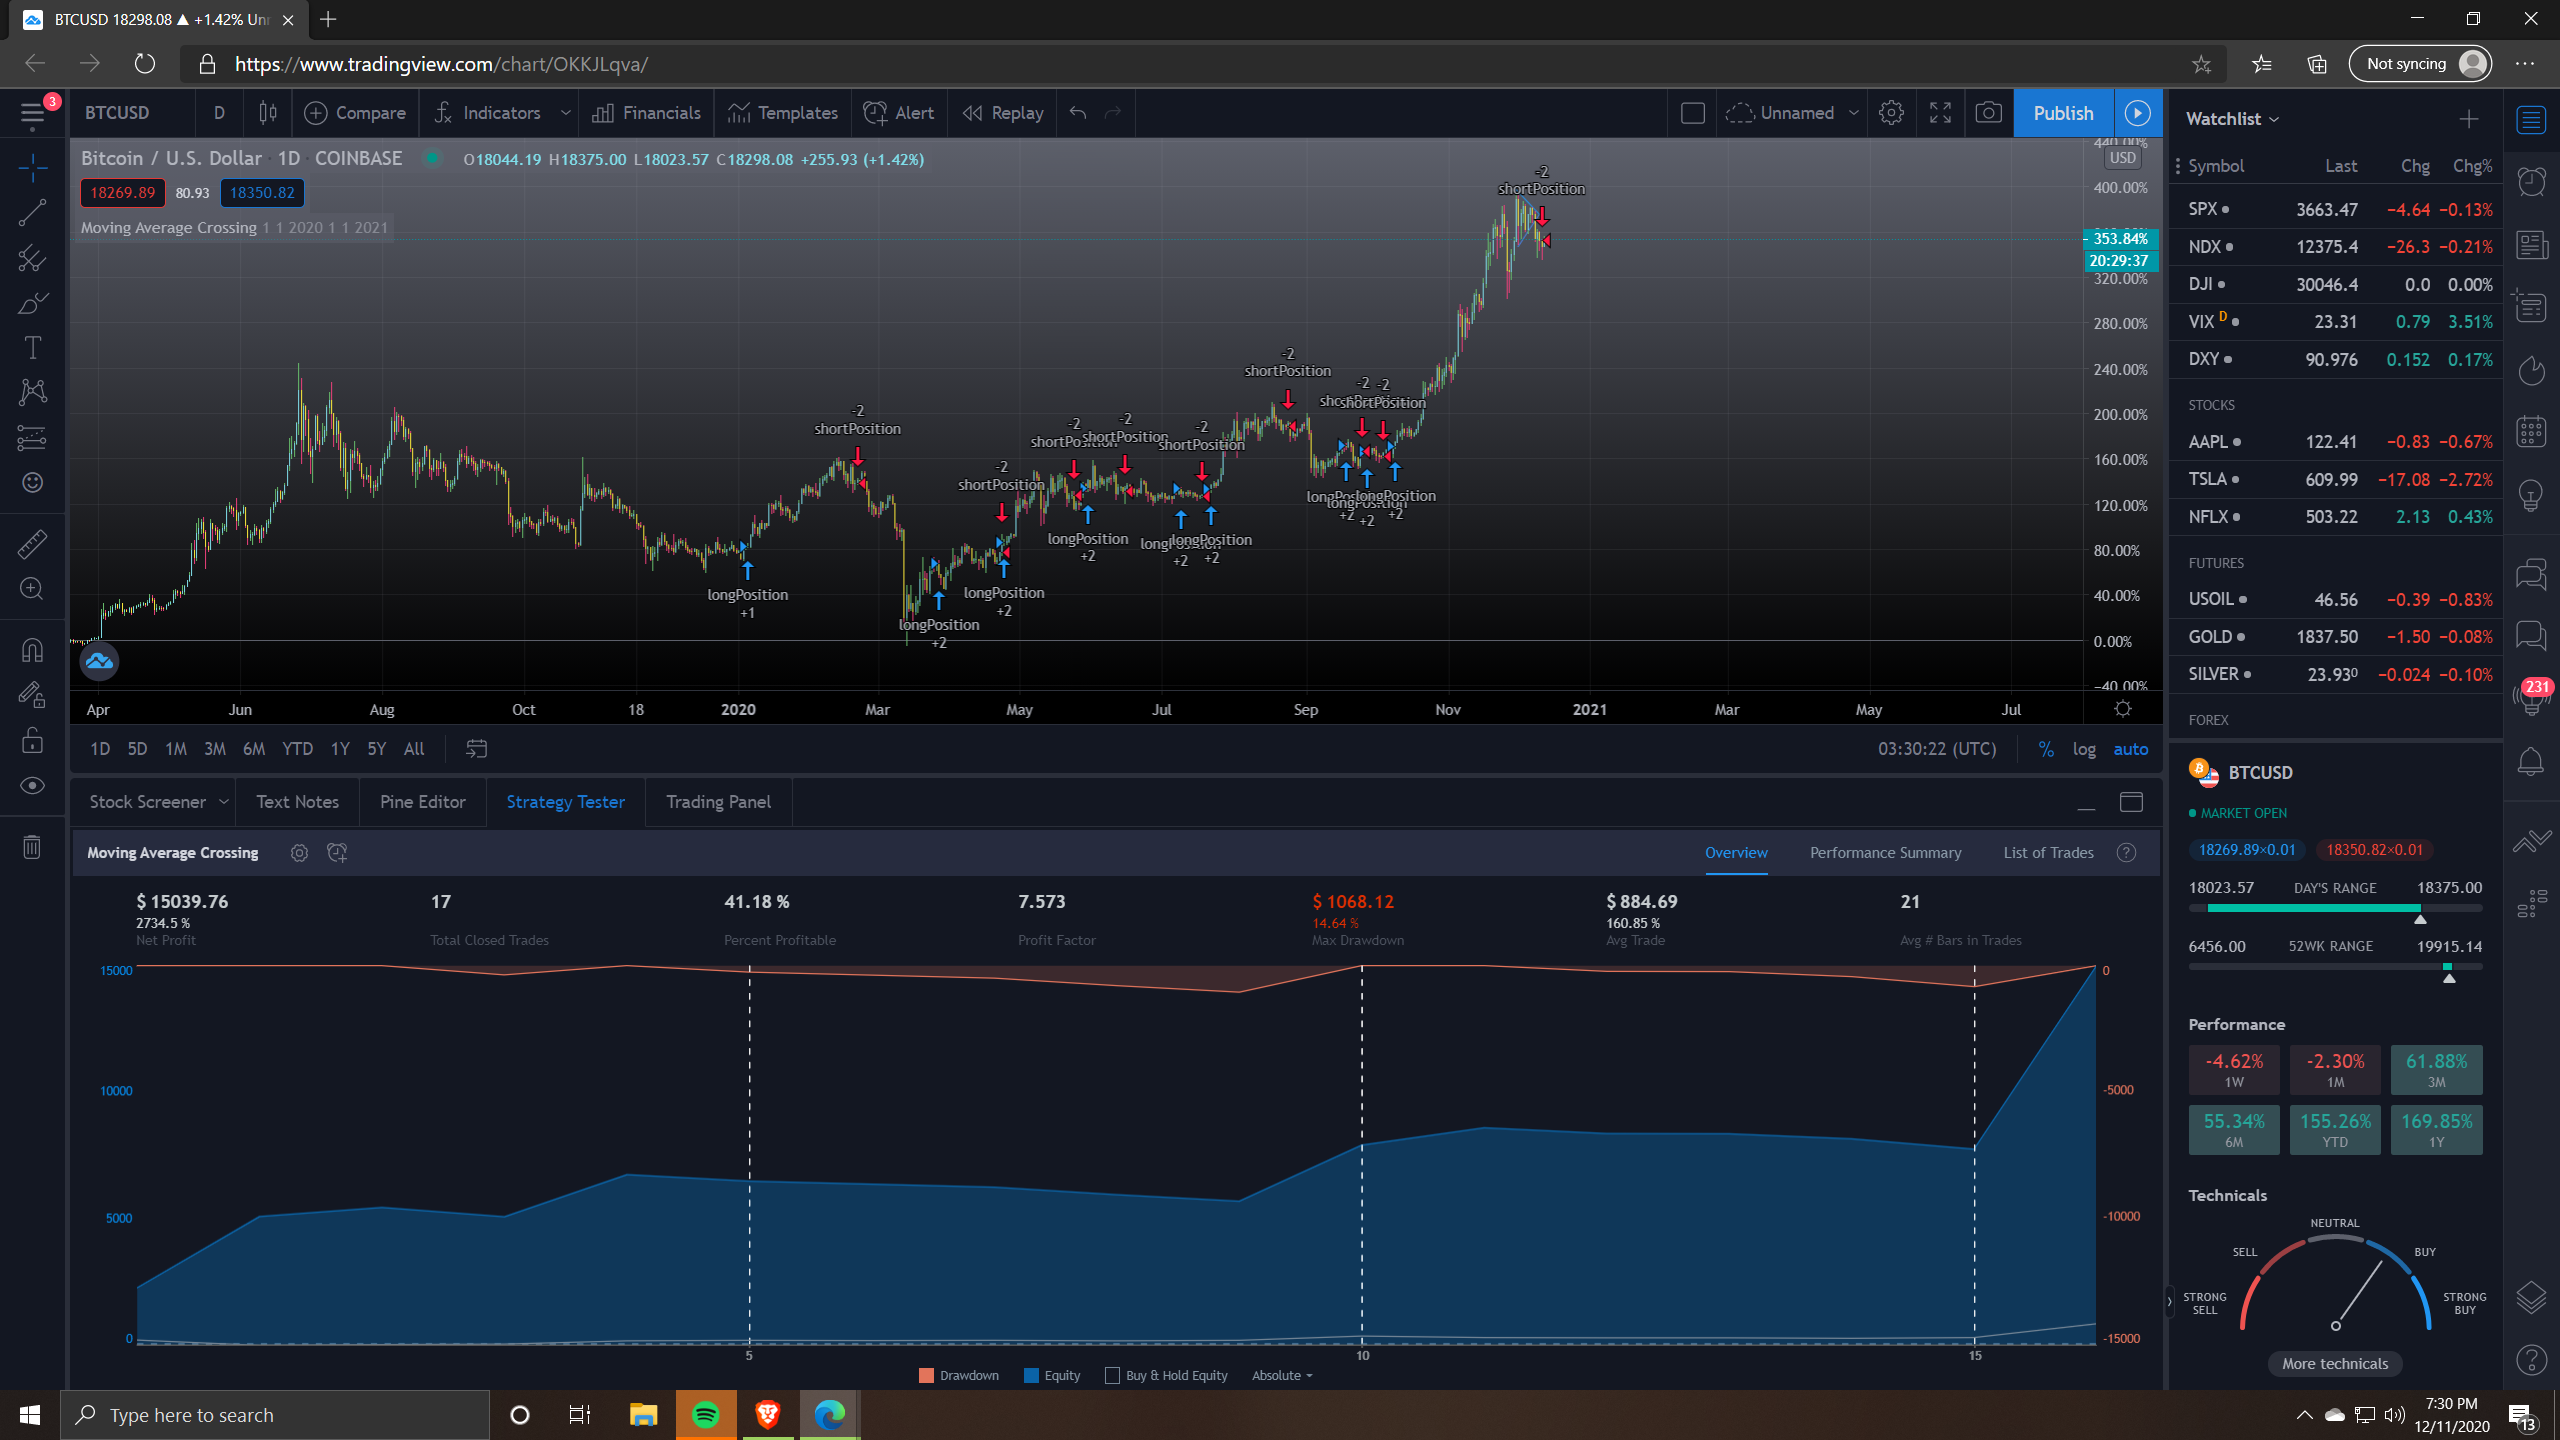
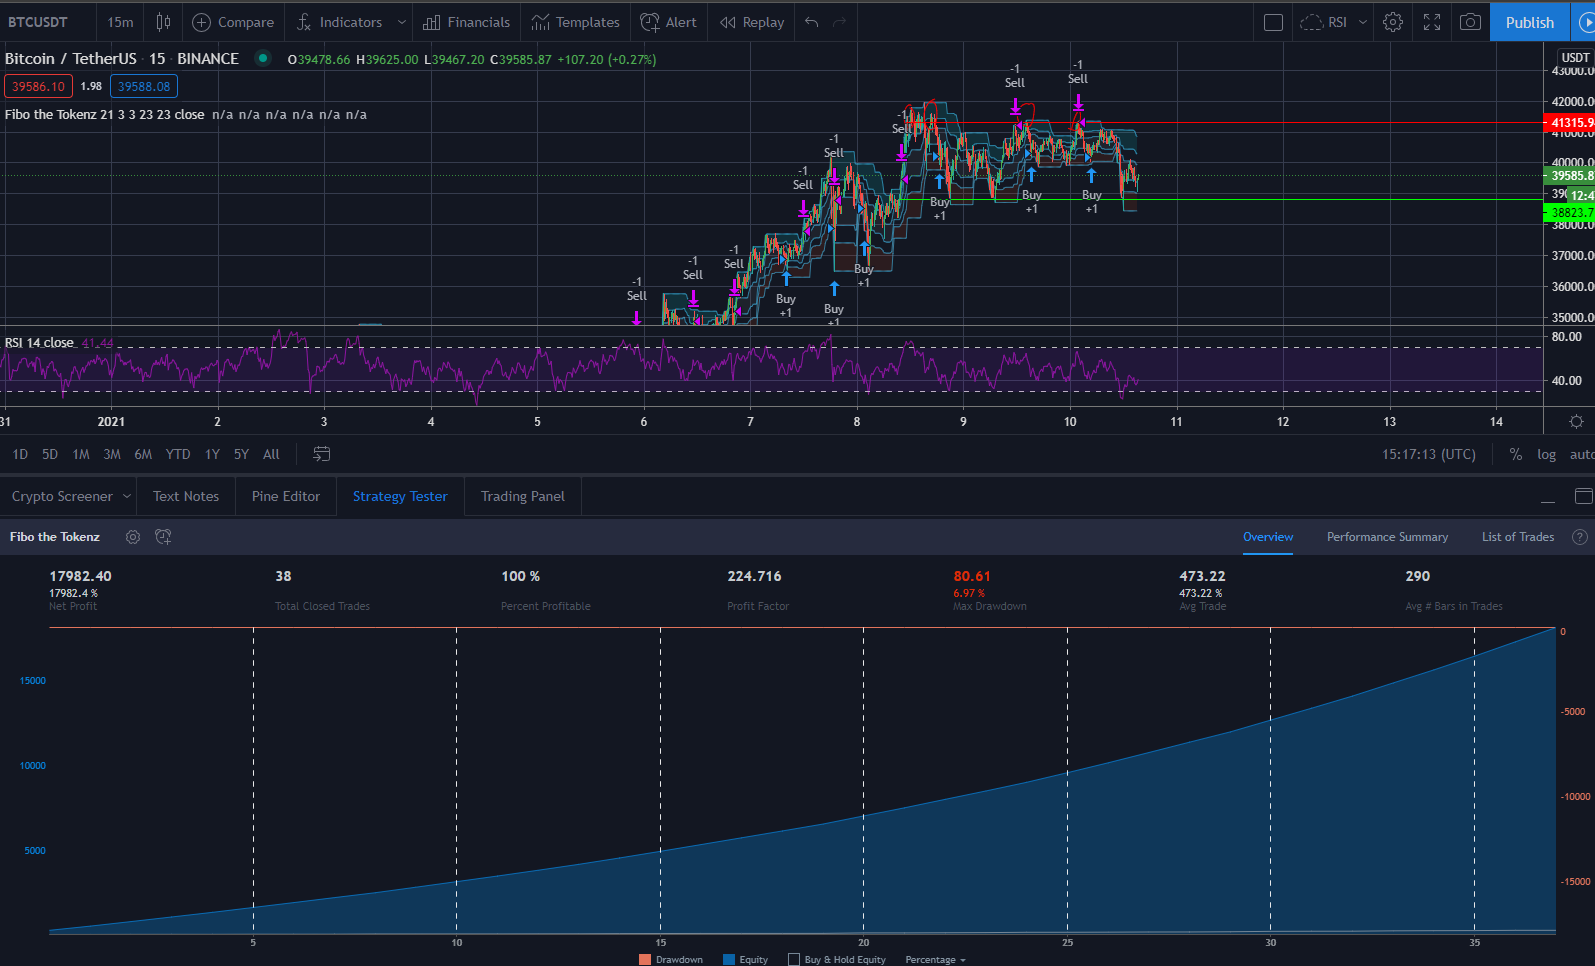
So, I just tinkered very lightly with what I was given by Filip. I wanted to avoid curve fitting at all costs, so I aimed to make my code SUPER simple. There are pretty good results here, and at a realistic entry for me as well. The BTC variant is based on the Daily chart w/ an initial capital of $1k, the ETH variant is based on the 4hr chart w/ $550 - both use 10x leverage. Neither have stop losses as I am a fervent watcher of the markets, although I would be more than happy to implement when I know more.
BTC:
strategy(title="Moving Average Crossing", overlay=true, initial_capital=1000, commission_type=strategy.commission.percent, commission_value=0.1)

//DATE and TIME, defval is default value
fromMonth = input(defval=1, title = "From month", minval=1)
fromDay = input(defval=1, title = "From day", minval=1)
fromYear = input(defval=2020, title = "From year", minval=2014)

toMonth = input(defval=1, title = "To month", minval=1)
toDay = input(defval=1, title = "To day", minval=1)
toYear = input(defval=2021, title = "To year", minval=2014)

//DEFINITIONS
shortMa = sma(close, 4)
longMa = sma(close, 21)
r = rsi(close, 14)

//LOGI, define the signals
timeInRange = (time > timestamp(fromYear, fromMonth, fromDay, 00,00)) and (time < timestamp(toYear, toMonth, toDay, 23, 59))
longSignal = crossover(shortMa, longMa) and timeInRange and r < 63
shortSignal = crossover(longMa, shortMa) and timeInRange and r > 44


//POSITIONS
strategy.entry(id="longPosition", long=true, qty=1.0, when=longSignal)
strategy.entry(id="shortPosition", long=false, qty=1.0, when=shortSignal)
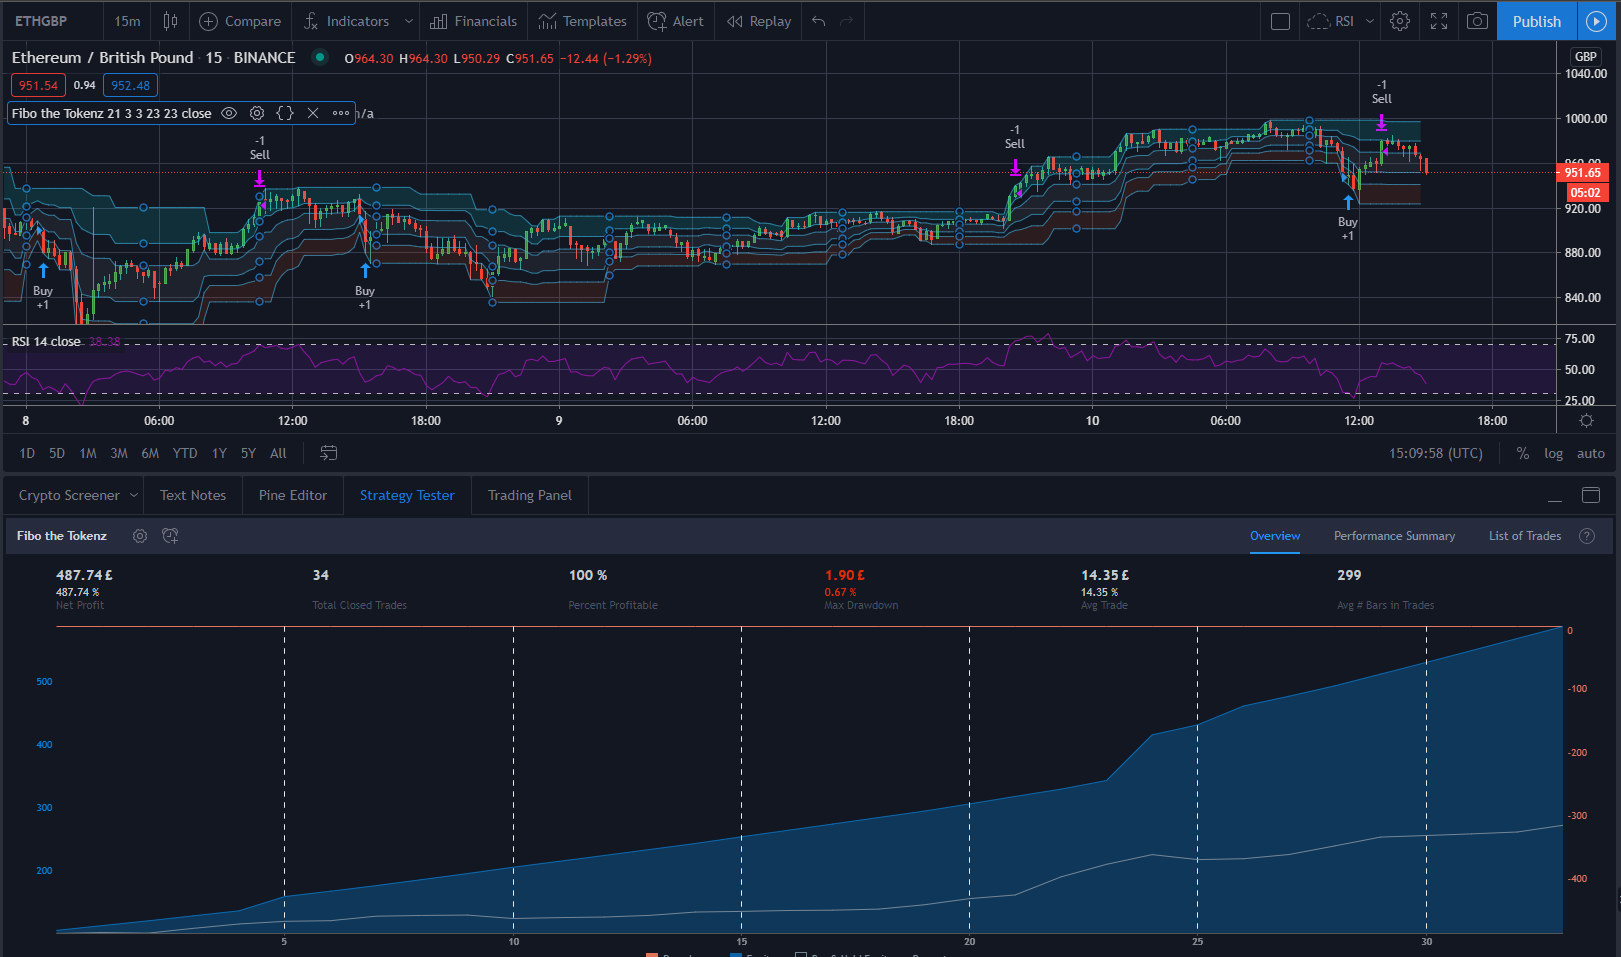
ETH:
strategy(title="Moving Average Crossing", overlay=true, initial_capital=550, commission_type=strategy.commission.percent, commission_value=0.1)

//DATE and TIME, defval is default value
fromMonth = input(defval=1, title = "From month", minval=1)
fromDay = input(defval=1, title = "From day", minval=1)
fromYear = input(defval=2020, title = "From year", minval=2014)

toMonth = input(defval=1, title = "To month", minval=1)
toDay = input(defval=1, title = "To day", minval=1)
toYear = input(defval=2021, title = "To year", minval=2014)

//DEFINITIONS
shortMa = sma(close, 4)
longMa = sma(close, 21)


//LOGI, define the signals
timeInRange = (time > timestamp(fromYear, fromMonth, fromDay, 00,00)) and (time < timestamp(toYear, toMonth, toDay, 23, 59))
longSignal = crossover(shortMa, longMa) and timeInRange
shortSignal = crossover(longMa, shortMa) and timeInRange


//POSITIONS
strategy.entry(id="longPosition", long=true, qty=10.0, when=longSignal)
strategy.entry(id="shortPosition", long=false, qty=10.0, when=shortSignal)
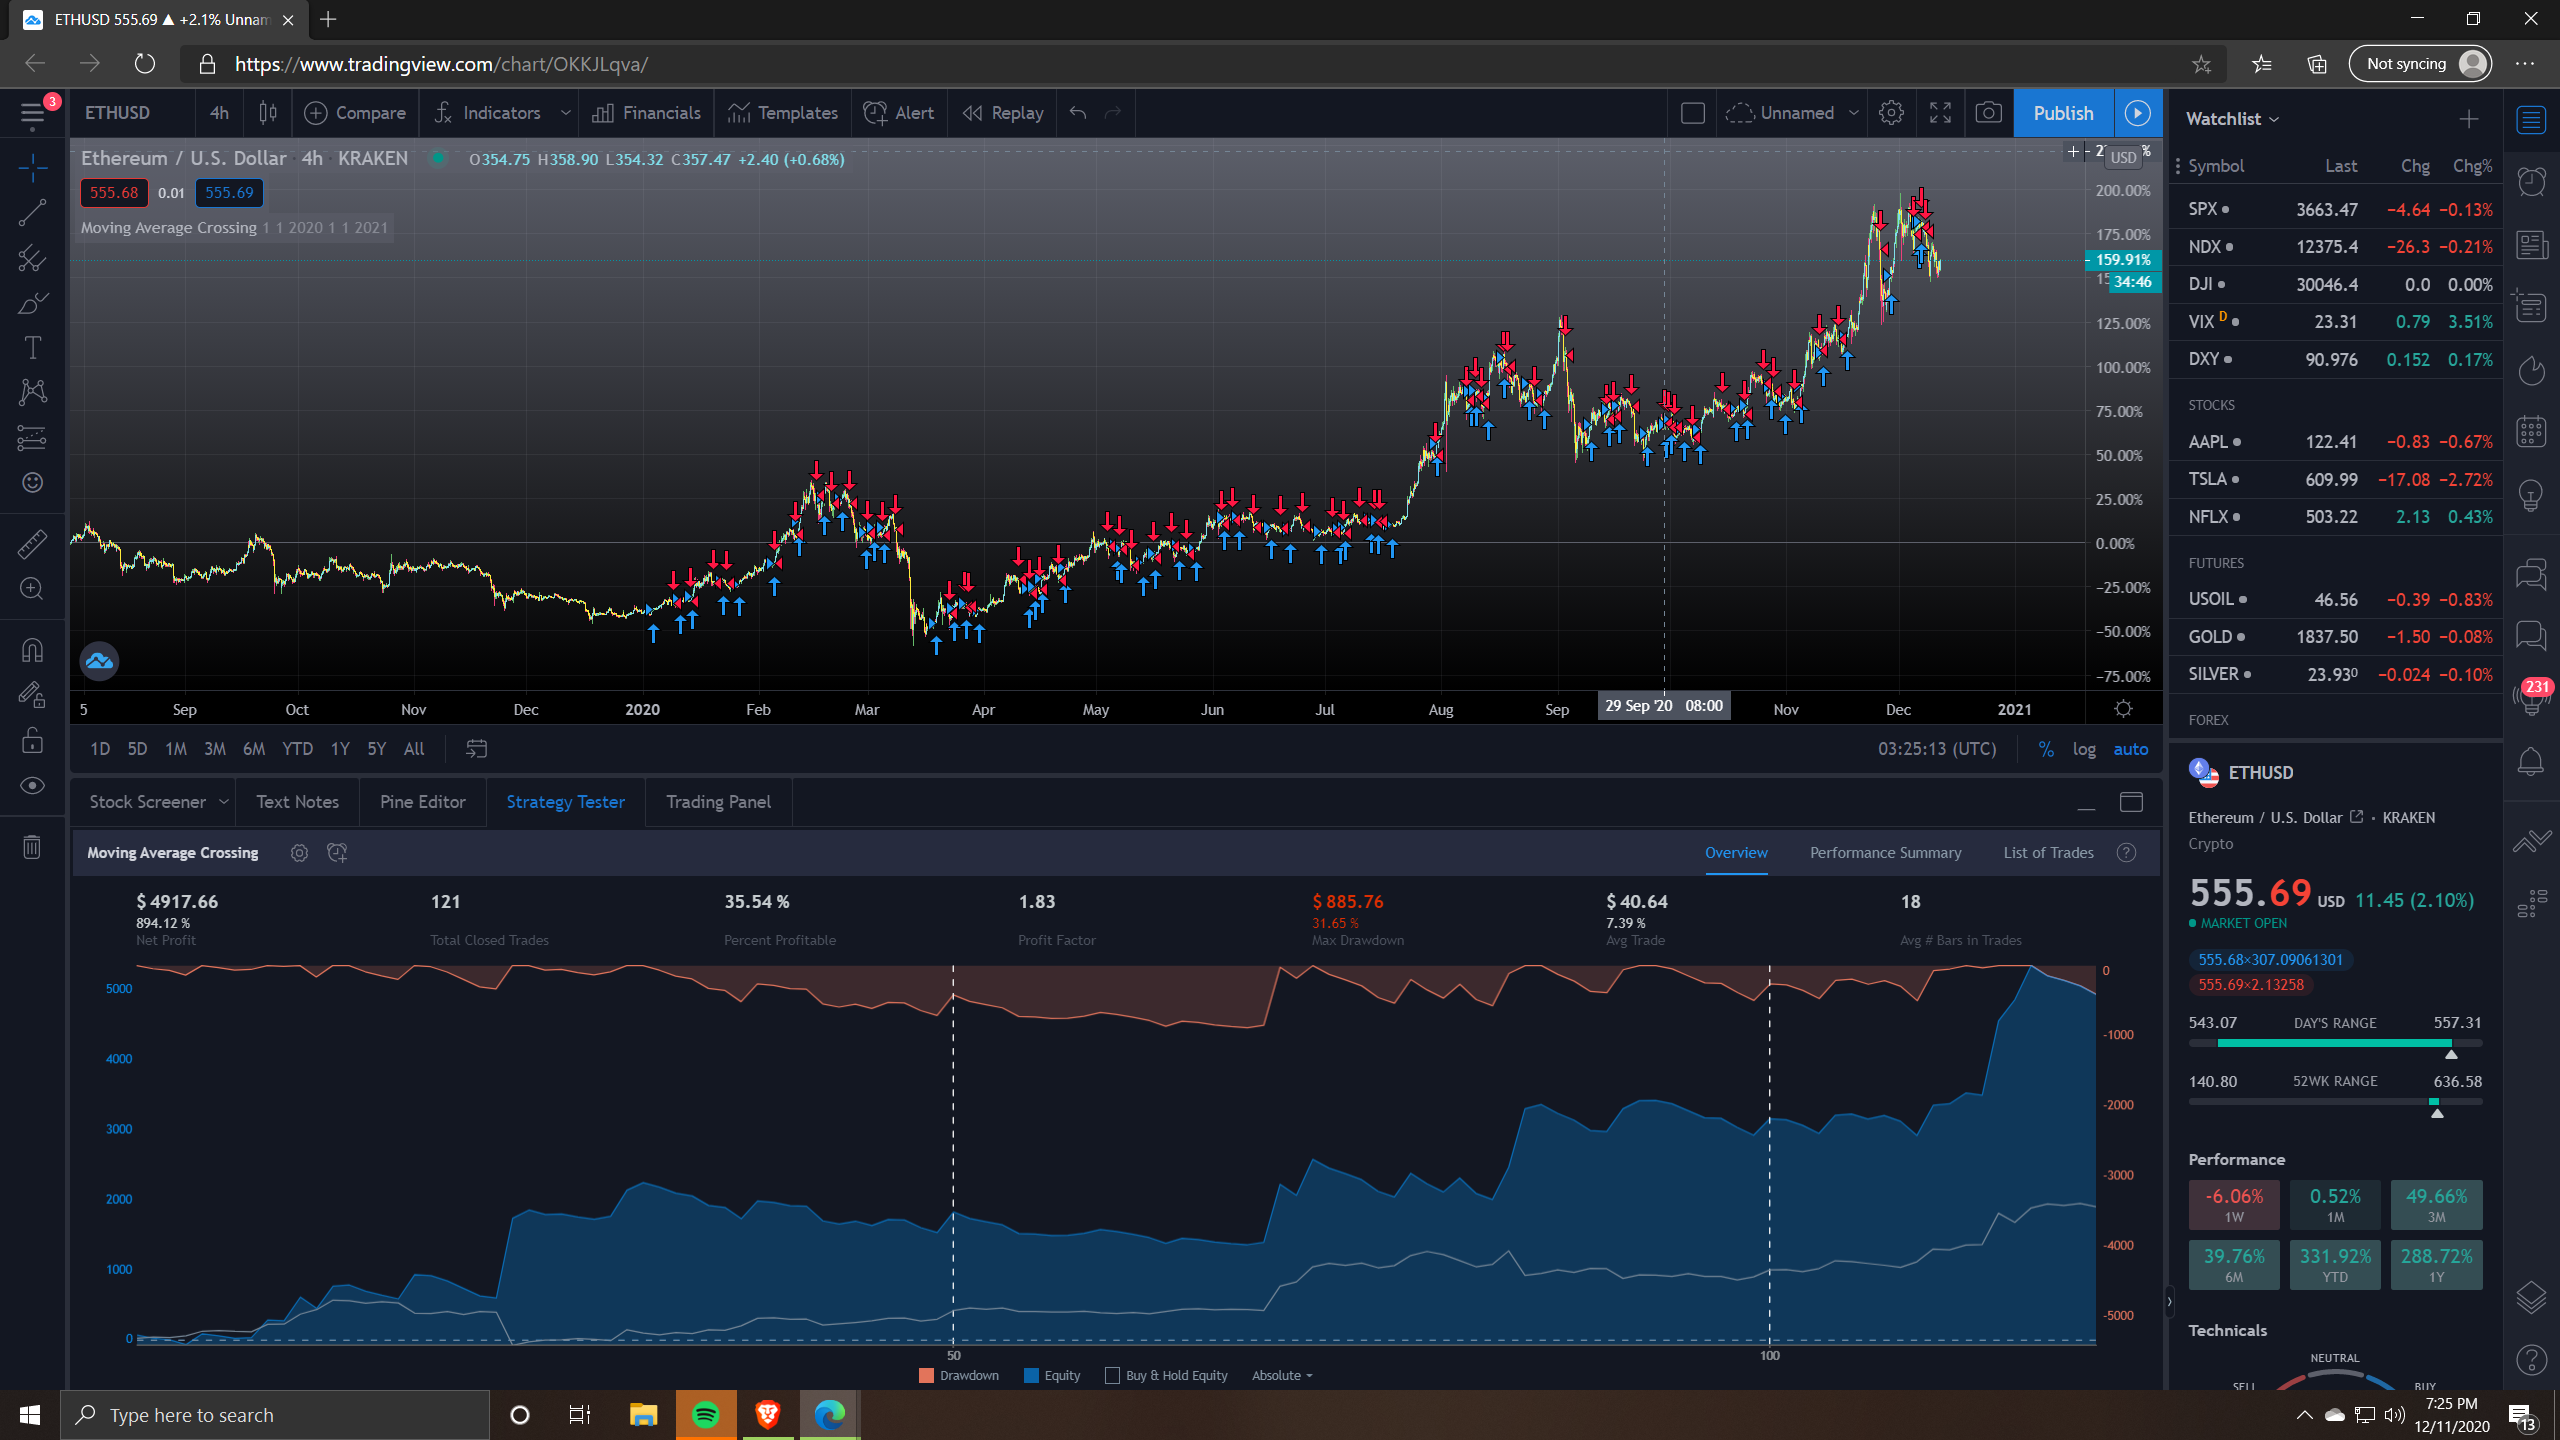
I haven’t figured out how to improve on the ETH beyond this point.
1 Like
Nice Job!
Maybe using different sma values could have better results? I found long ago that long term sma (50, 200 days) works better in terms of Profit Factor.
Carlos Z.
1 Like
I adopted your strategy and basically just played around with different moving averages combination. This combination seems to yield the optimal results for me. A big caveat when back testing is that this strategy works well during bull market data and not so much during bear market (not sure if that counts as cheating as almost everyone does well in a bull market…=b). Although downside during bear markets aren’t too bad I guess hehe…
strategy(title=“Moving Average Crossing”, overlay=true, initial_capital=2000, commission_type=strategy.commission.percent, commission_value=.02)
//DATE AND TIME
fromMonth = input(defval=9, title = “From month”, minval=1)
fromDay = input(defval=15, title = “From day”, minval=1)
fromYear = input(defval=2020, title = “From year”, minval=2014)
toMonth = input(defval=12, title=“To month”, minval=1)
toDay = input(defval=15, title=“To day”, minval=1)
toYear = input(defval=2020, title=“To year”, minval=2014)
//DEFINITIONS
shortMa = sma(close, 20)
longMa = sma(close, 30)
r = rsi(close, 14)
//LOGIC
timeInRange = (time > timestamp(fromYear, fromMonth, fromDay, 00, 00)) and (time < timestamp(toYear, toMonth, toDay, 23, 59))
longSignal = crossover(shortMa, longMa) and timeInRange and r < 50
shortSignal = crossover(longMa, shortMa) and timeInRange and r > 50
//POSITIONS
strategy.entry(id=“longPosition”, long=true, qty=0.1, when=longSignal)
strategy.entry(id=“shortPosition”, long=false, qty=0.1, when=shortSignal)
1 Like
Hi Phillip, ive tried changing the obvious MA, Length, time, date, amount, percentages, some work but most have failed with errors. I looked through the replies and the forum and its very mixed with the answers. Are those the changes you wanted or am I supposed to start from scratch from a pee loaded script?
1 Like
Hi @Cowboy_D, hope you are well.
From my perspective, the idea of the code showed in the course is to show you the basics, off course you can change, modify or improve the provided script, it will be a challenge for yourself.
So, you can start from scratch or use the provided script to improve it for you.
If you have any more questions, please let us know so we can help you!
Carlos Z.
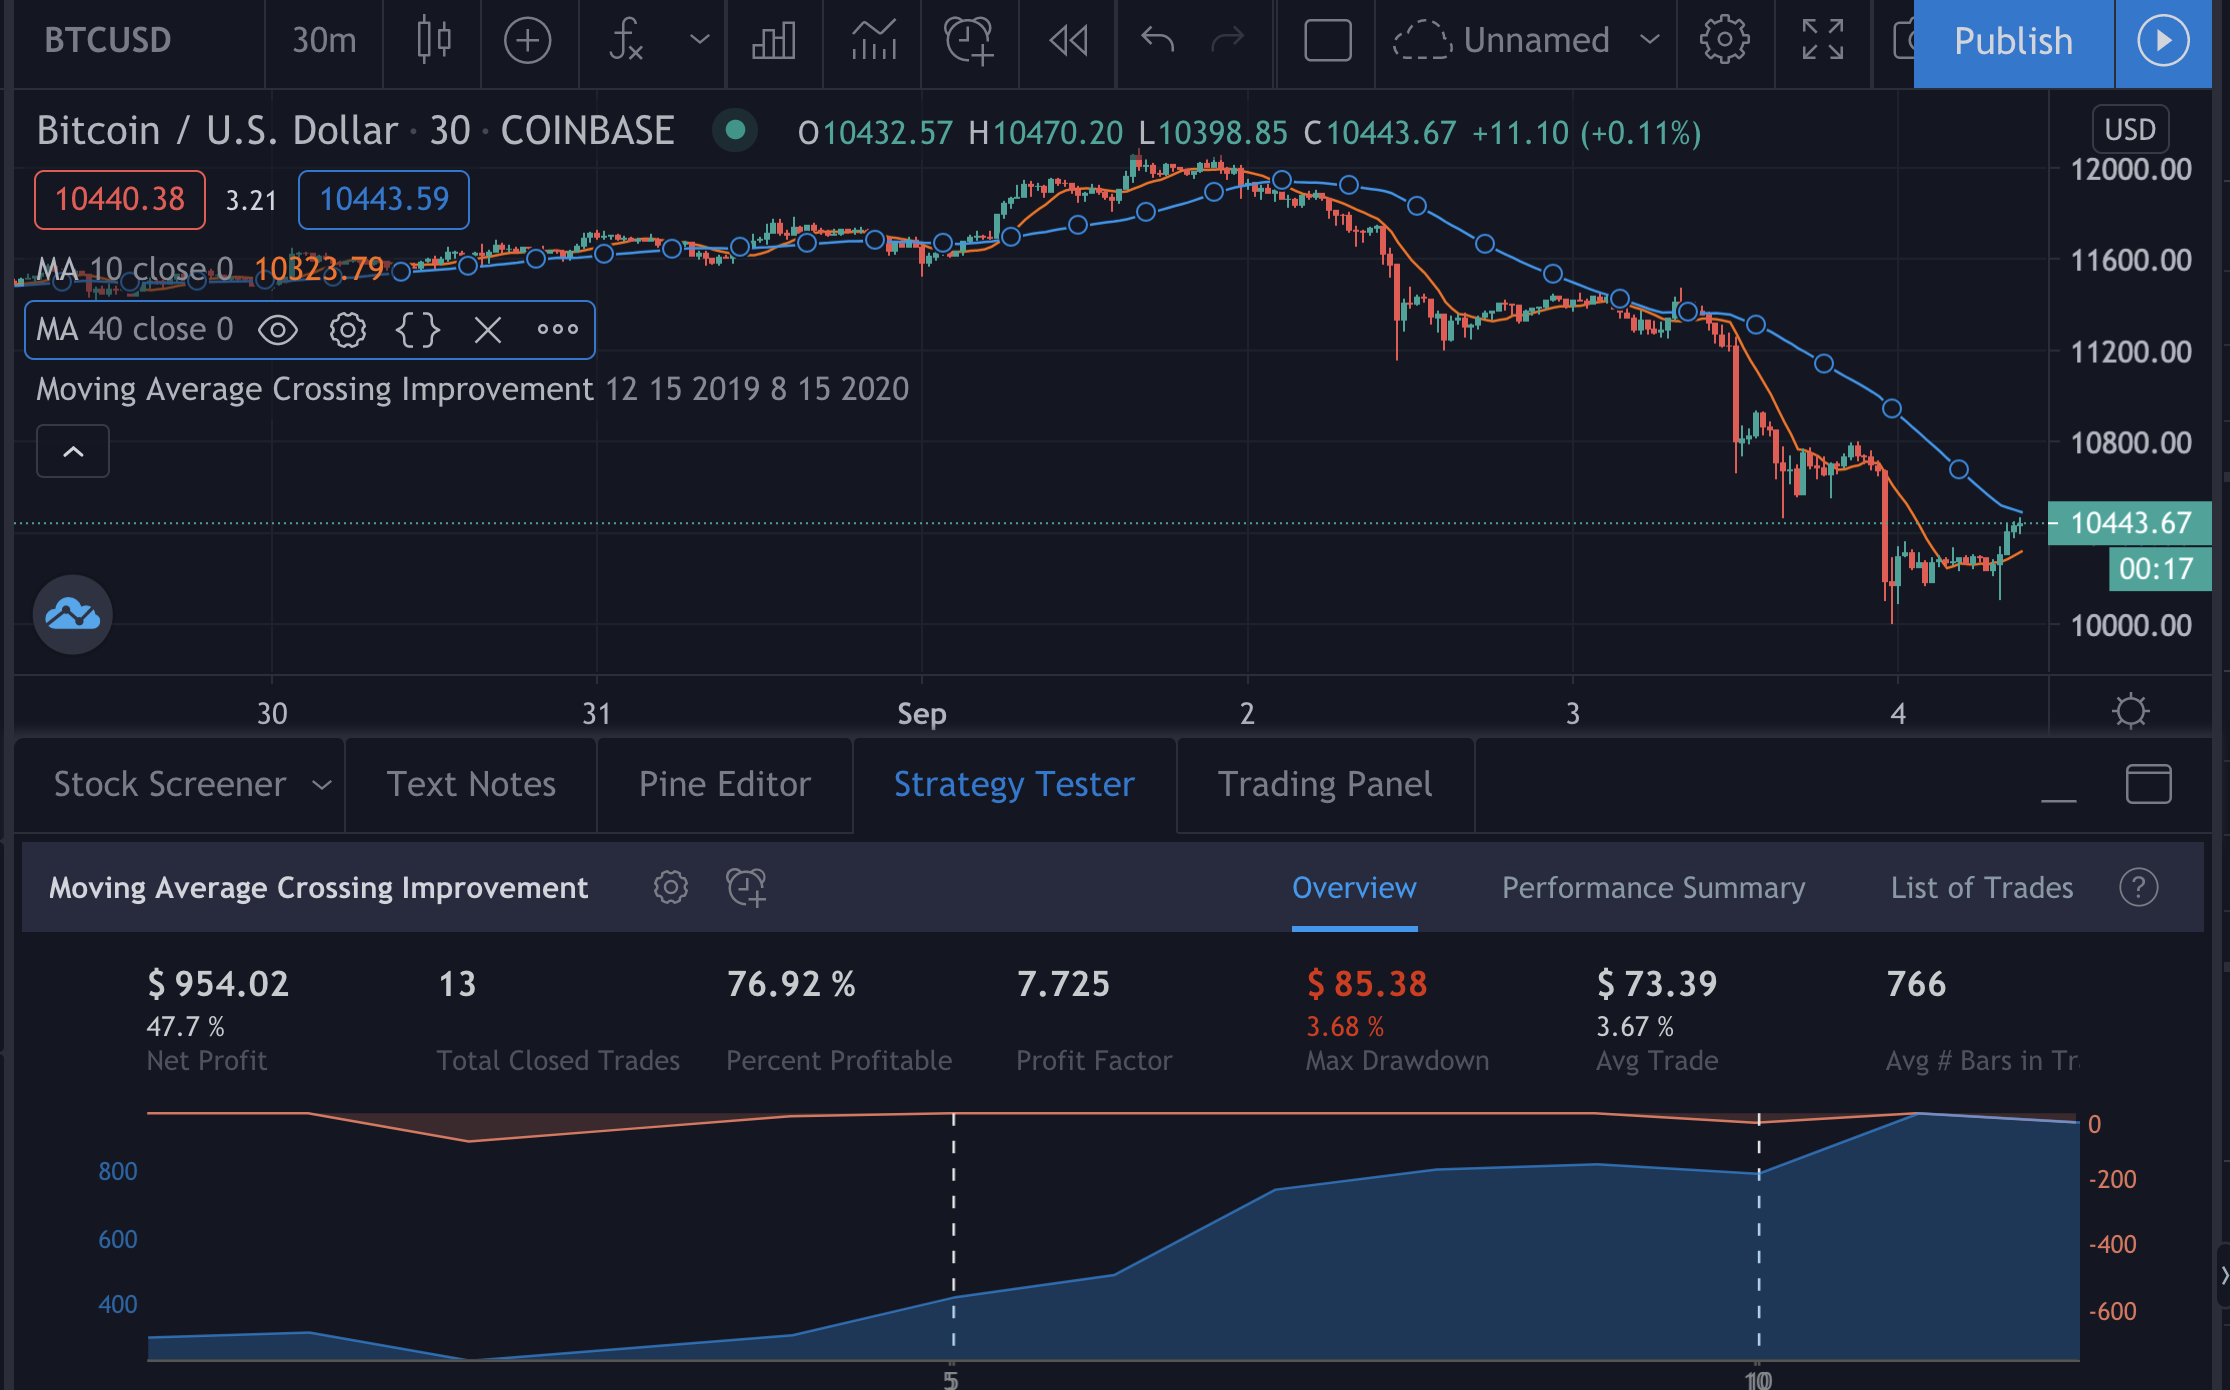
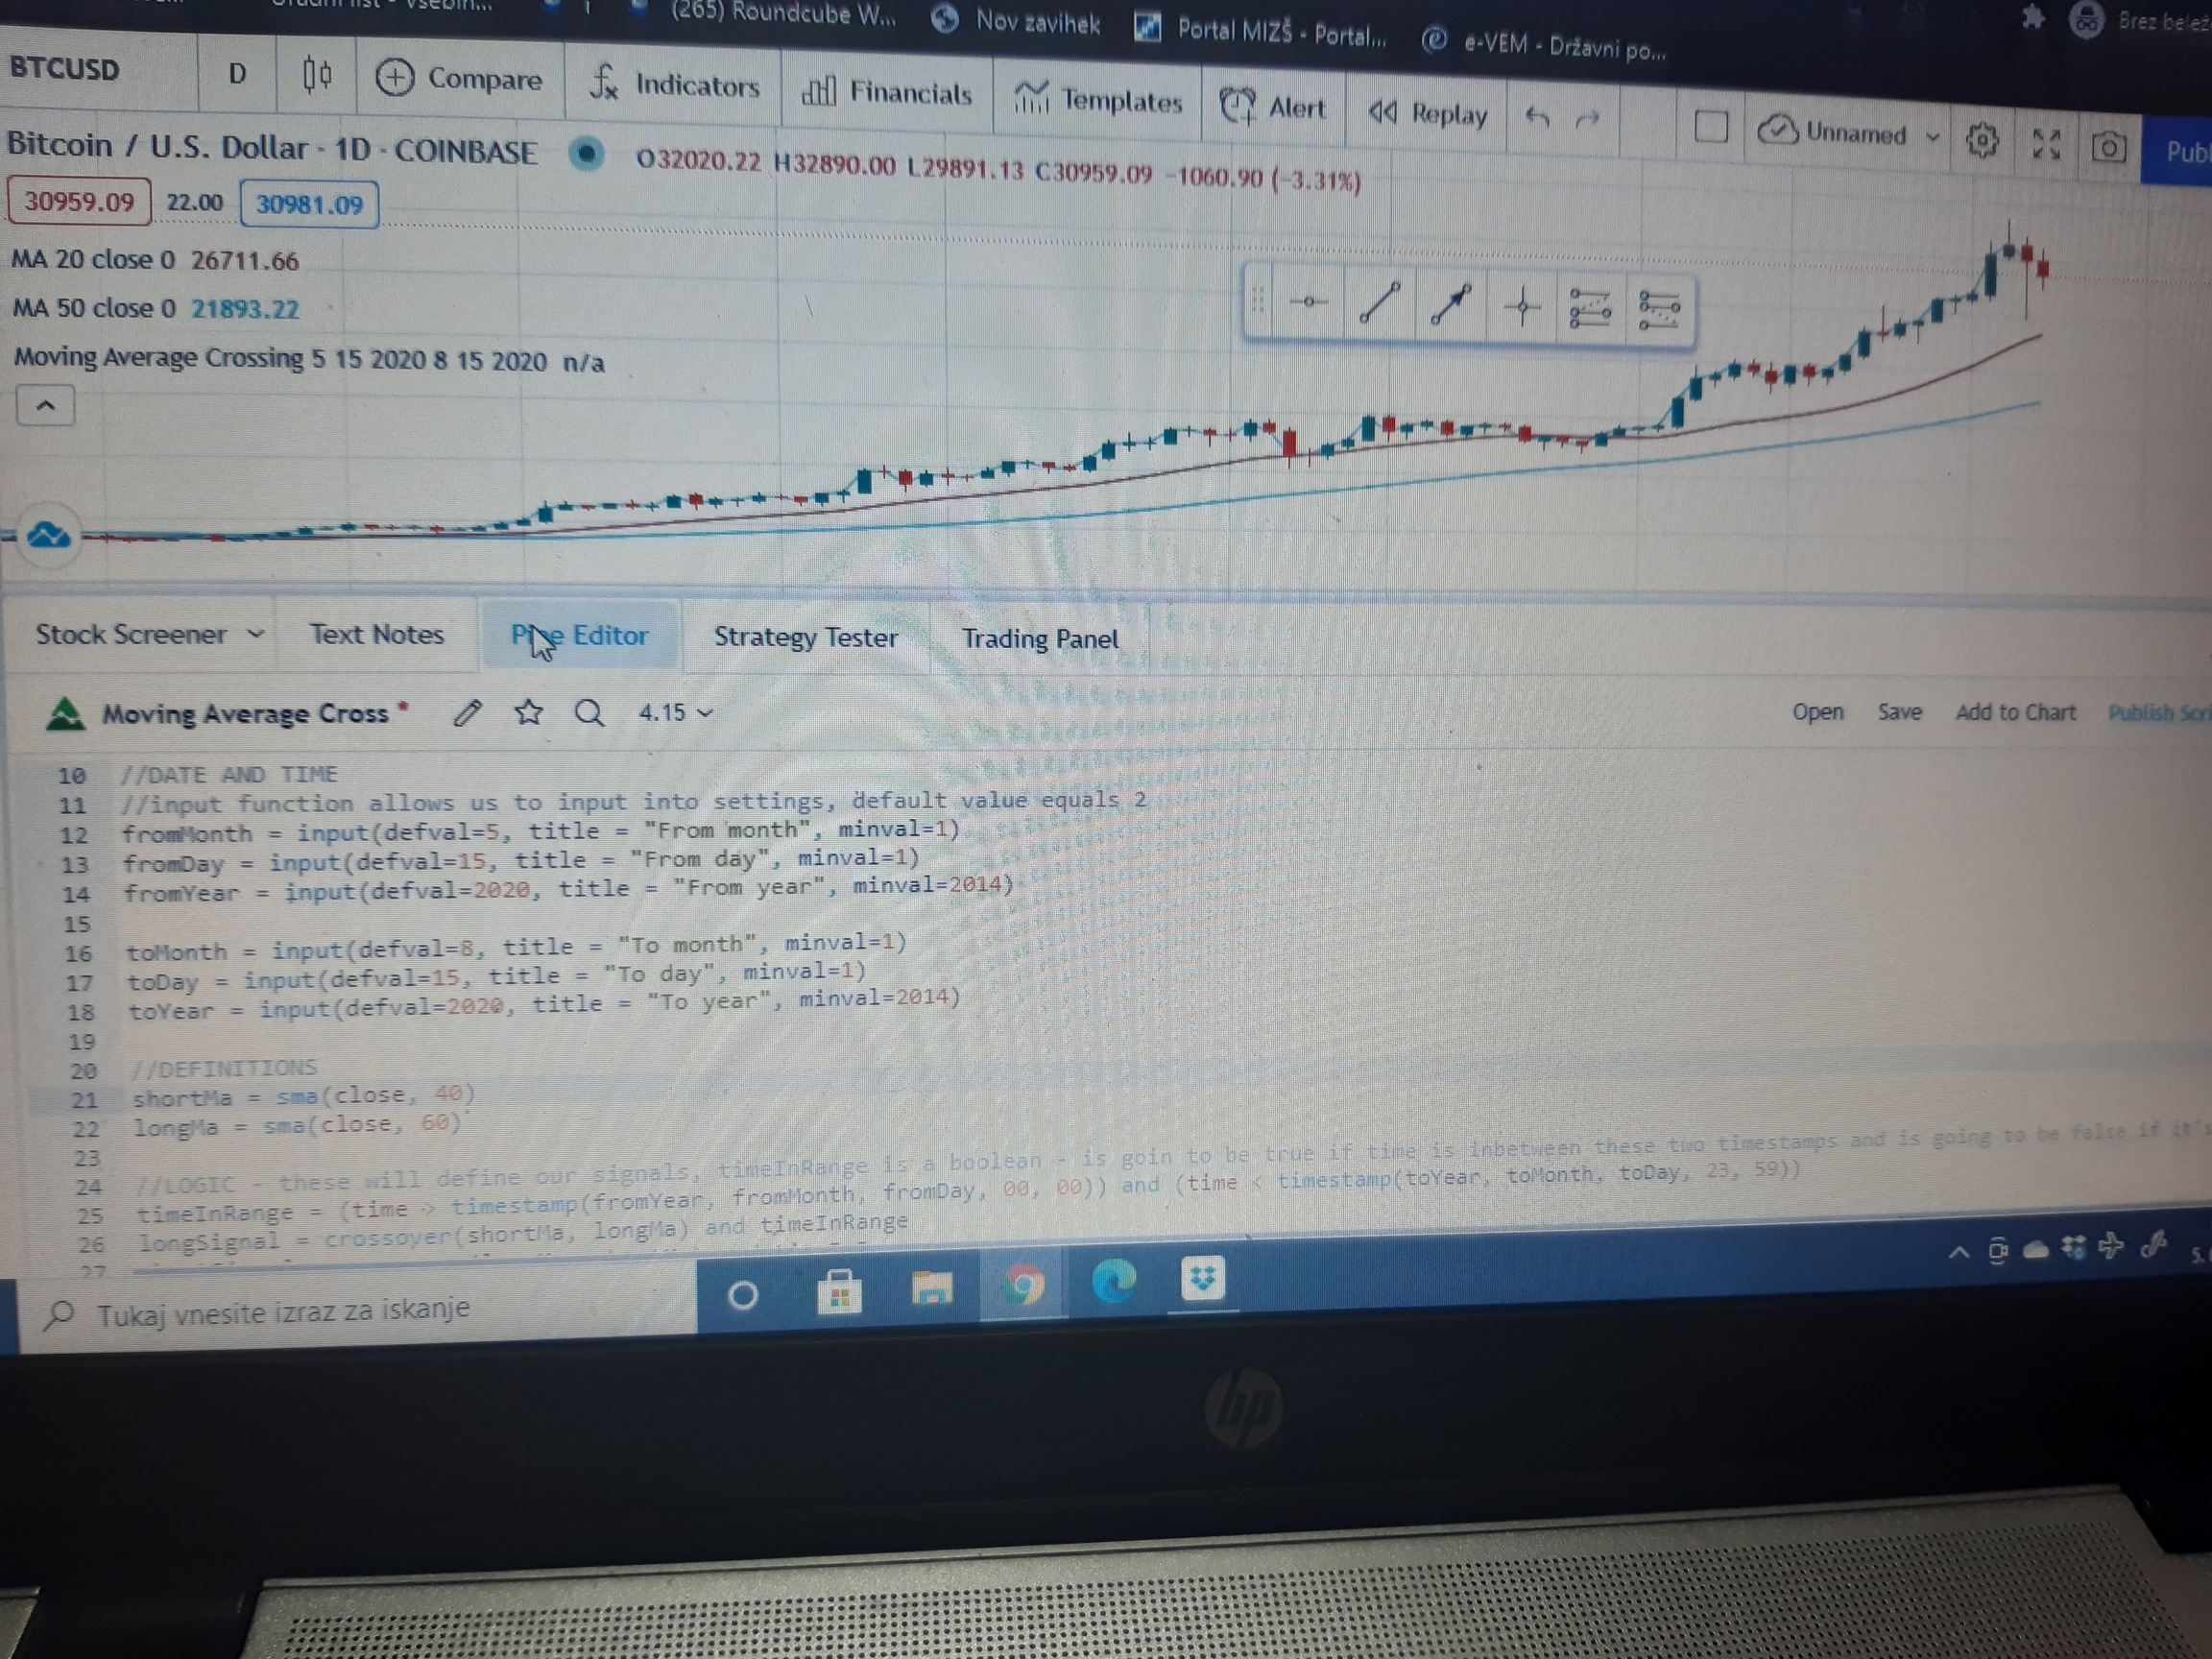
I am using your strategy since I learned JS basic last year and it’s first time I am understanding some code with a ‘real’ use case:
- Timeframe: 5.15.2020-8.15.2020, longMa 40, ShortMa 60 gave me best result in strategy tester (playing from 20 - 80 MA), Net profit $ 264,08
Code:
//@version=3
plot(close)
strategy(title=“Moving Average Crossing”, overlay=true, initial_capital=2000, commission_type=strategy.commission.percent, commission_value=0.2)
//DATE AND TIME
//input function allows us to input into settings, default value equals 2
fromMonth = input(defval=5, title = “From month”, minval=1)
fromDay = input(defval=15, title = “From day”, minval=1)
fromYear = input(defval=2020, title = “From year”, minval=2014)
toMonth = input(defval=8, title = “To month”, minval=1)
toDay = input(defval=15, title = “To day”, minval=1)
toYear = input(defval=2020, title = “To year”, minval=2014)
//DEFINITIONS
shortMa = sma(close, 40)
longMa = sma(close, 60)
//LOGIC
timeInRange = (time > timestamp(fromYear, fromMonth, fromDay, 00, 00)) and (time < timestamp(toYear, toMonth, toDay, 23, 59))
longSignal = crossover(shortMa, longMa) and timeInRange
shortSignal = crossover(longMa, shortMa) and timeInRange
//POSITIONS
stategy.entry(id=“longPosition”, long=true, qty=0.1, when=longSignal)
strategy.entry(id=“shortPosition”, long=false, qty=0.1, when=shortSignal)
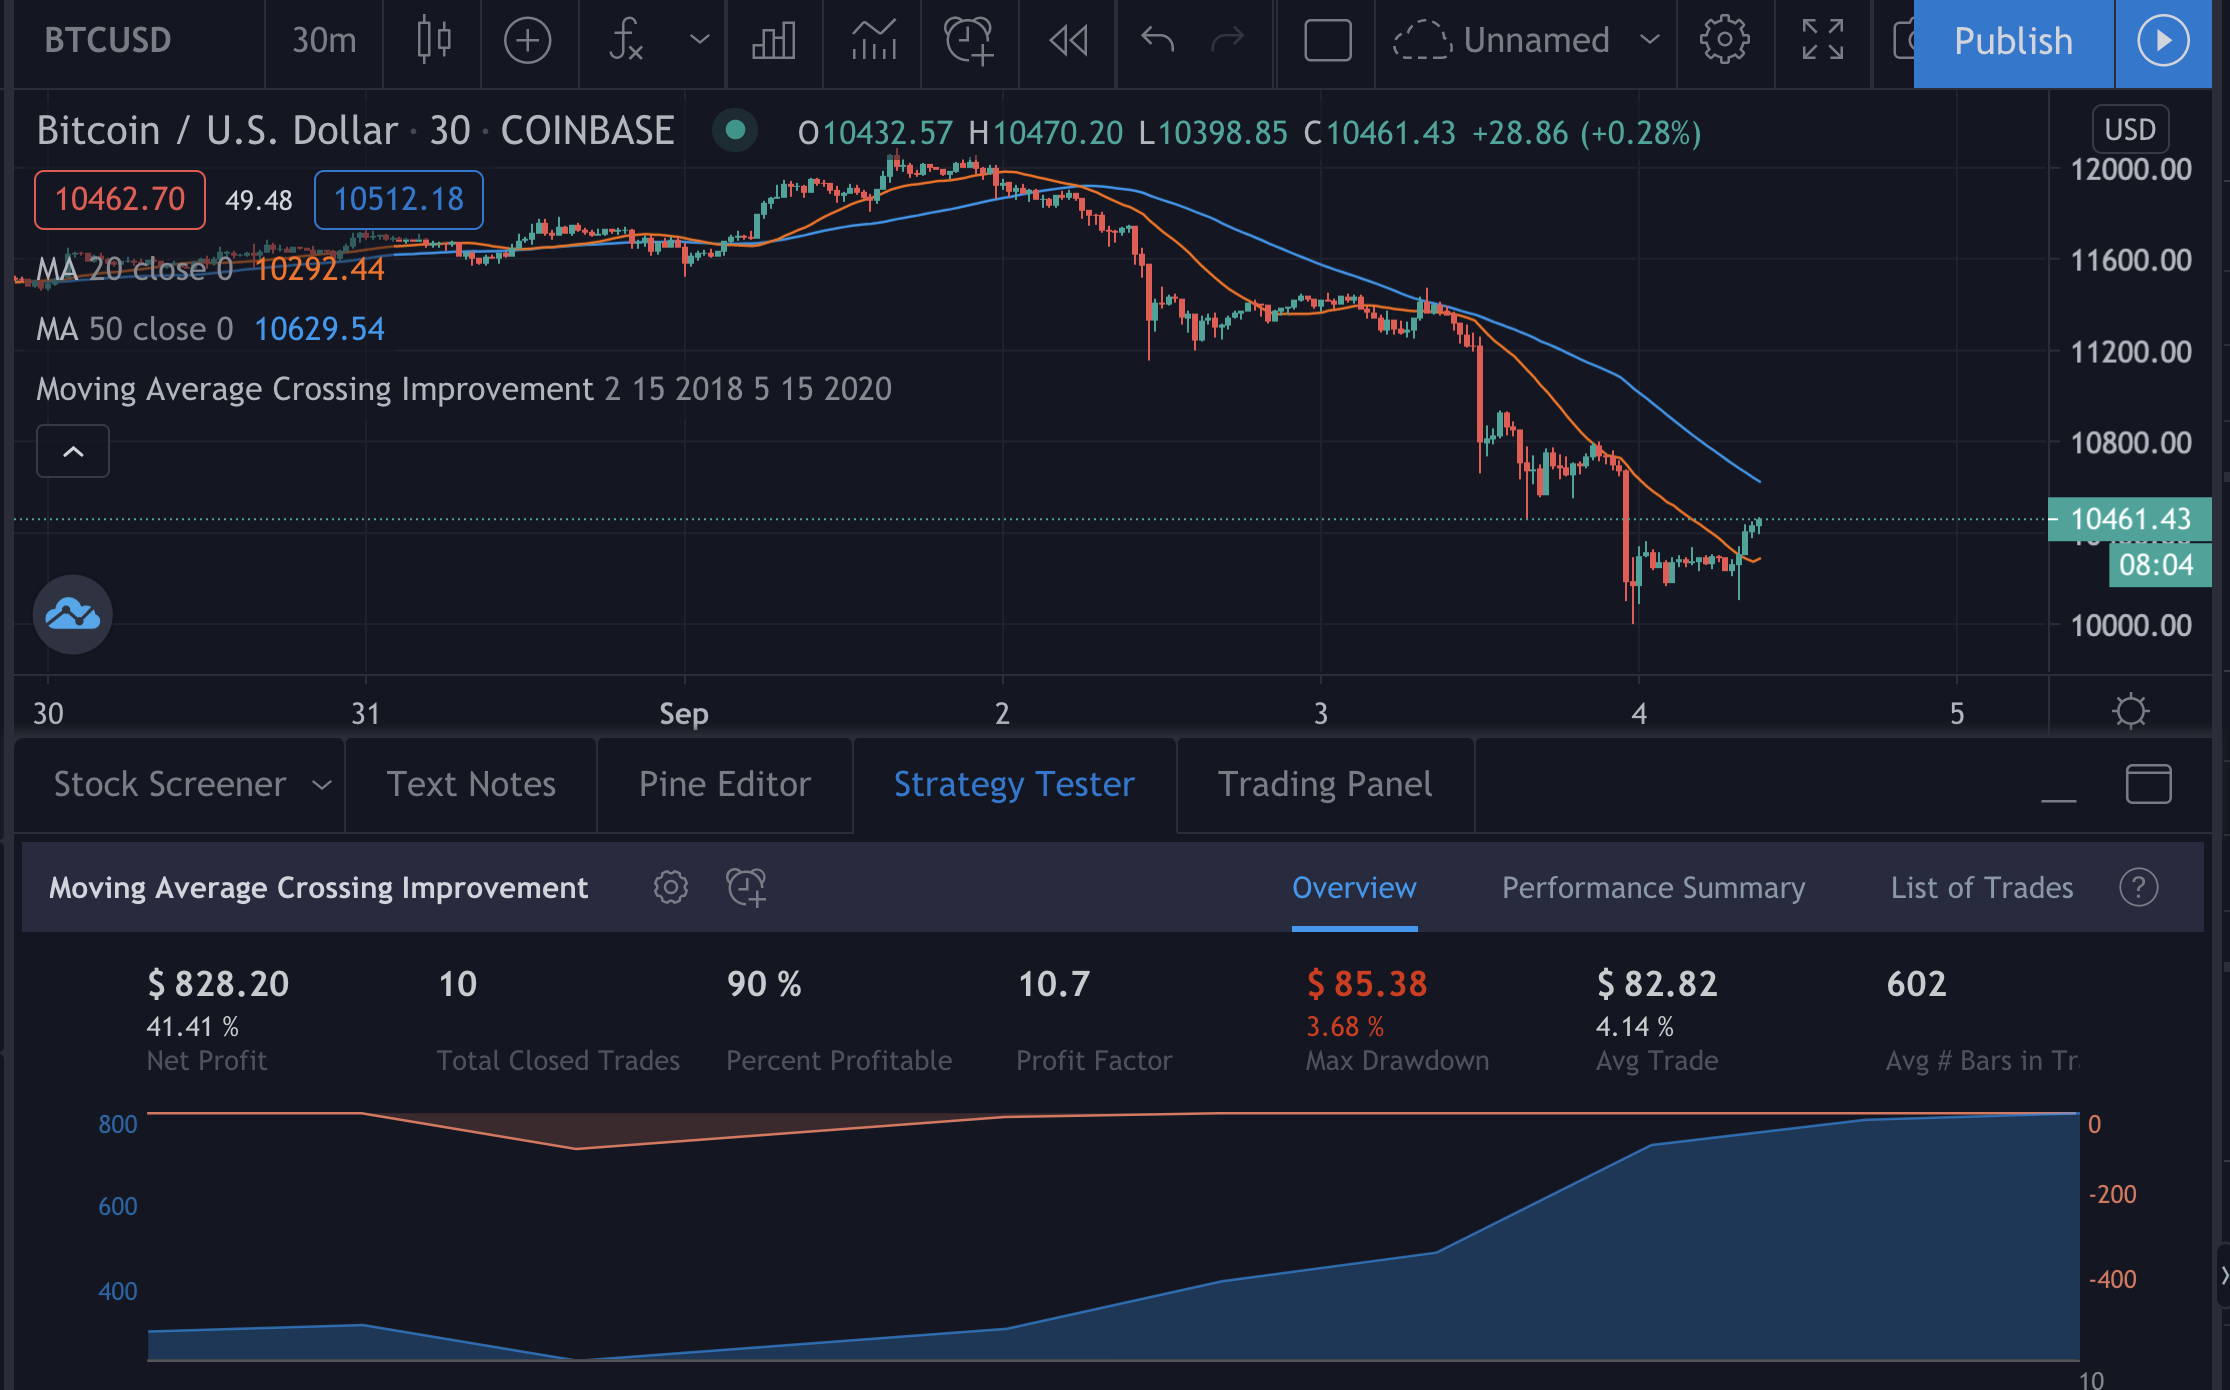
- Applying the same longMa 40, ShortMa 60 on Timeframe 2.15.2020-5.15.2020,
gave me an even better result than the previous in strategy tester
- (playing from 20 - 80 MA), Net profit $ 383,49.
- 30 - 70 MA would give app. the same $ 386,98
- 30 - 90 MA would give even better result $ 454,55
- 50 - 200 MA would give $ 347,55
Code:
//@version=3
plot(close)
strategy(title=“Moving Average Crossing”, overlay=true, initial_capital=2000, commission_type=strategy.commission.percent, commission_value=0.2)
//DATE AND TIME
//input function allows us to input into settings, default value equals 2
fromMonth = input(defval=2, title = “From month”, minval=1)
fromDay = input(defval=15, title = “From day”, minval=1)
fromYear = input(defval=2020, title = “From year”, minval=2014)
toMonth = input(defval=5, title = “To month”, minval=1)
toDay = input(defval=15, title = “To day”, minval=1)
toYear = input(defval=2020, title = “To year”, minval=2014)
//DEFINITIONS
shortMa = sma(close, 30)
longMa = sma(close, 90)
//LOGIC
timeInRange = (time > timestamp(fromYear, fromMonth, fromDay, 00, 00)) and (time < timestamp(toYear, toMonth, toDay, 23, 59))
longSignal = crossover(shortMa, longMa) and timeInRange
shortSignal = crossover(longMa, shortMa) and timeInRange
//POSITIONS
strategy.entry(id=“longPosition”, long=true, qty=0.1, when=longSignal)
strategy.entry(id=“shortPosition”, long=false, qty=0.1, when=shortSignal)
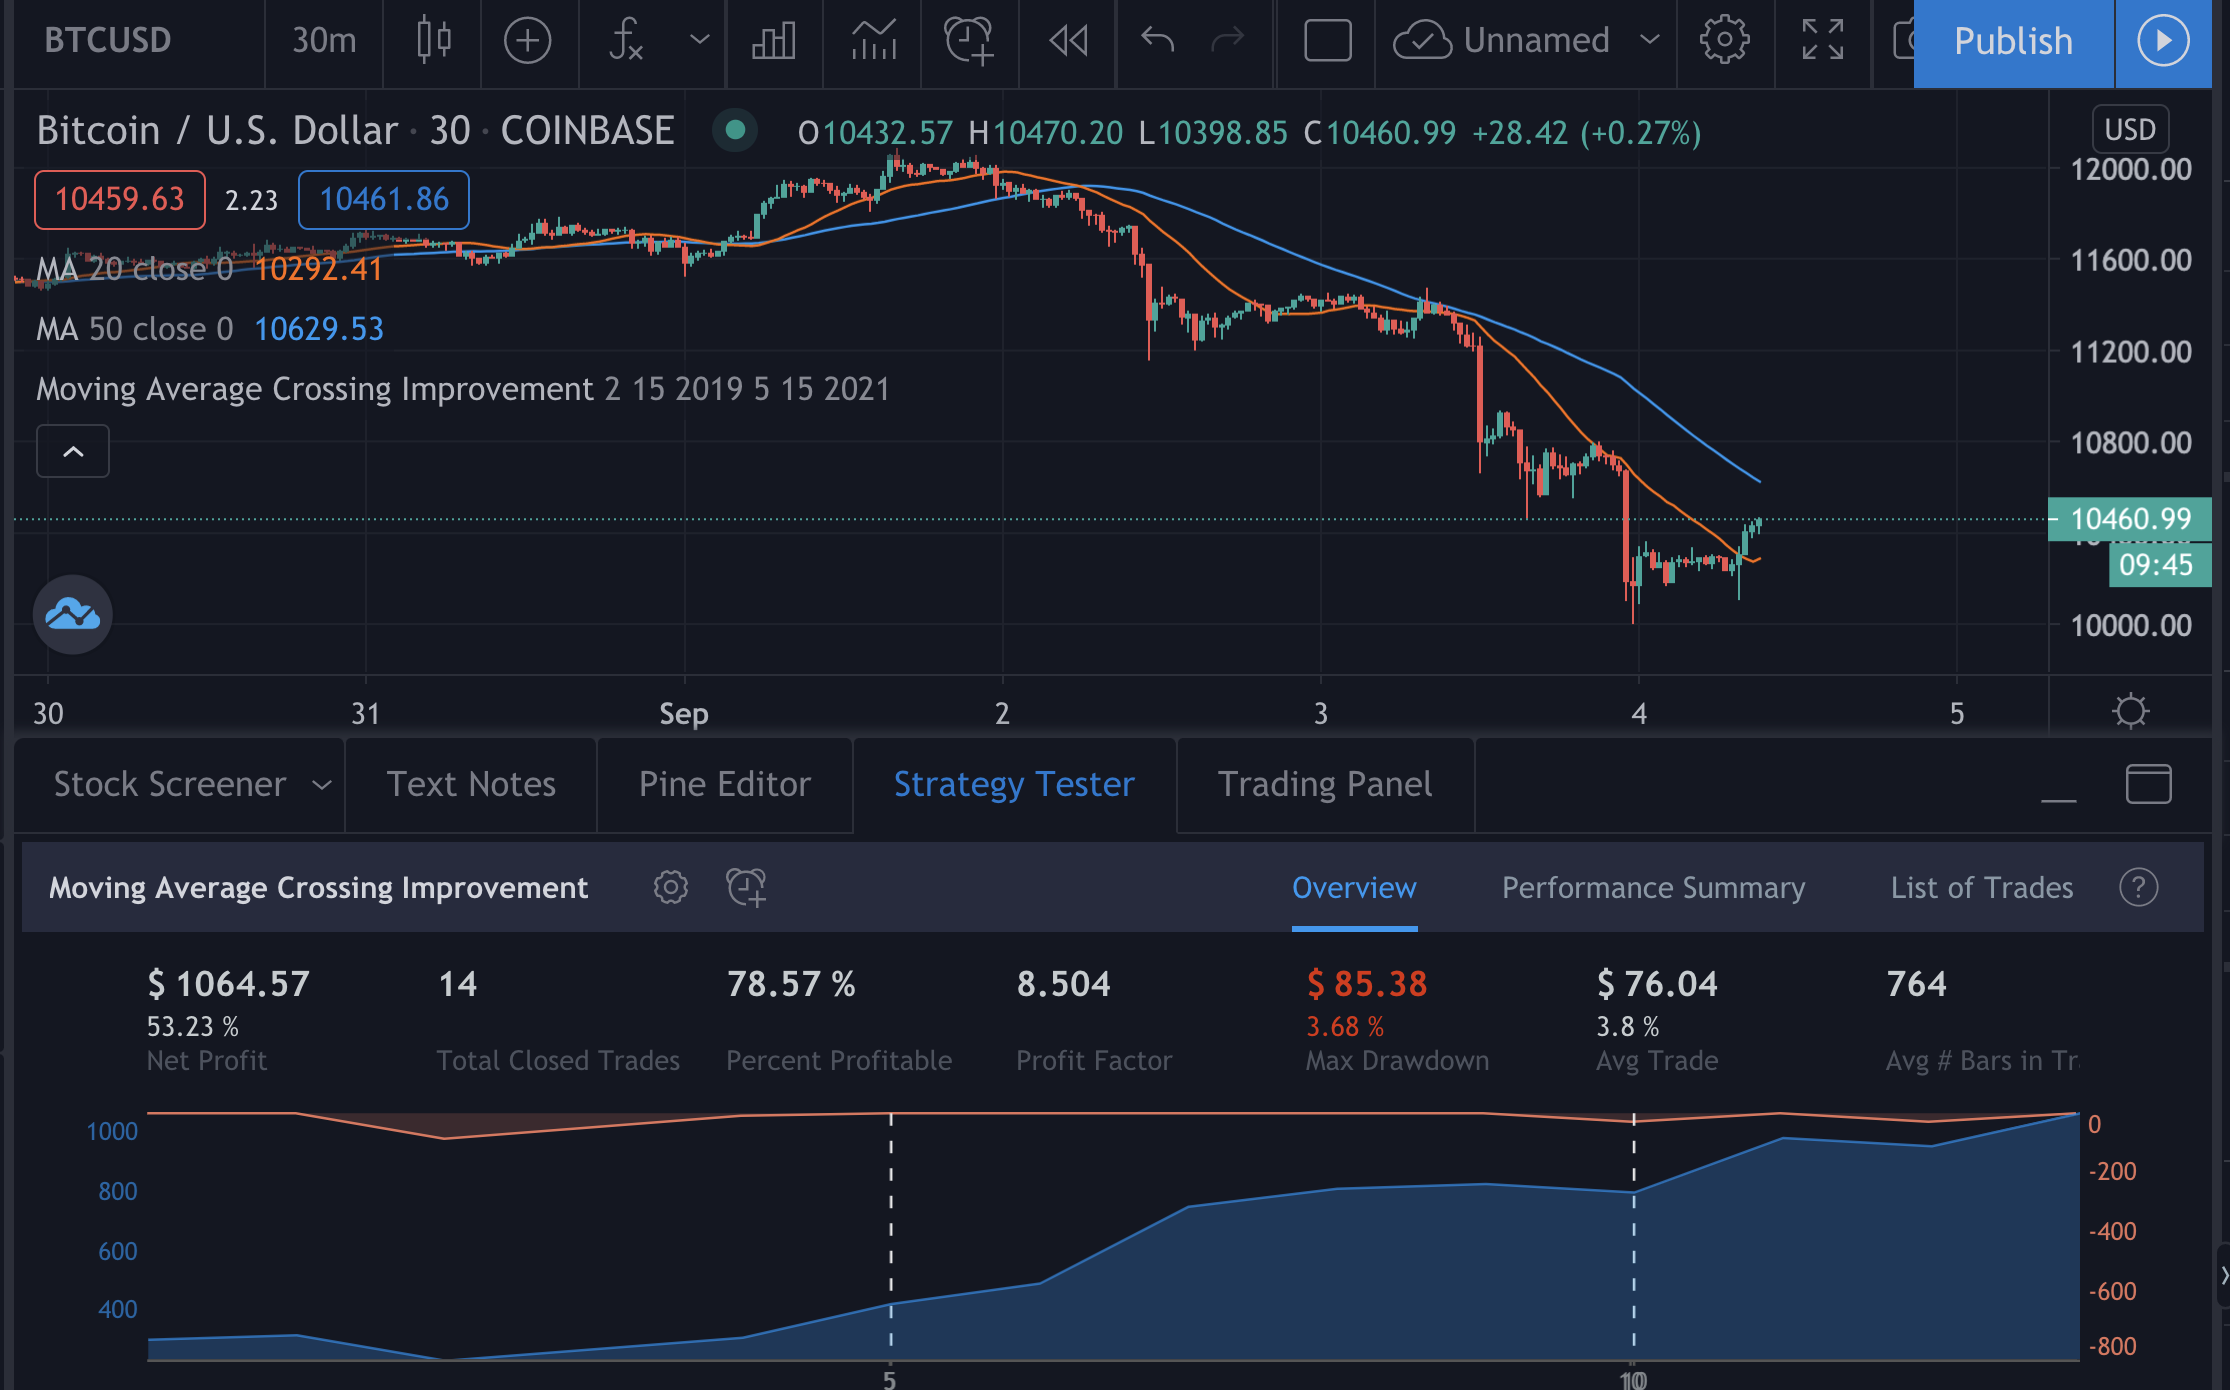
However applying this last:
- 50 - 200, 30 -70 or 30 - 90 MA on a Timeframe: 2.15.2019-5.15.2019 or 8.15.2019-11.15.2019 (one year back than before) would give $ 2 or less.
Uploading: Trading strategy 2_2_383.jpg… Uploading: Trading strategy 1_2_264.jpg… Uploading: Trading strategy 2_1_2.15._5_15.2020.jpg…
1 Like
If anything, this must be a programming task, as the process is a simple algorithm:
10 Begin
15 i=1
20 j=2
25 While i<1000
30 While j>i
40 Evaluate strategy i, j
50 store result
60 i=i+1
70 Endwhile
80 j=j+1
85 i=1
90 Endwhile
99 End
Not yet usable, but as we might have some parameters to play with, an automated optimization must be a good idea.
1 Like
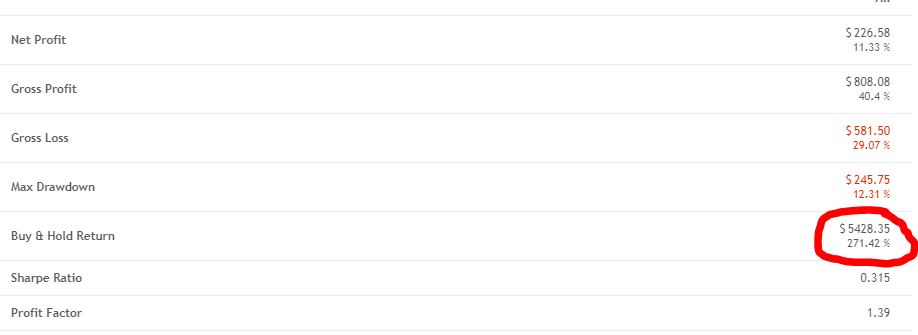
How do I adjust the Buy and Hold return? It does not follow the strategy dates. (The strategy opened at $9340 and closed at $8780. With my calculations the B&H yields -$560 not +$5400)
1 Like
The Buy & Hold Return just define the porcentage of what could happen if you just buy and hold instead of trading, just a meassure.
Maybe you wanna look into this wrapper to go deeper on that subject:
https://www.tradingview.com/script/MBA1fy0d-Strategy-VS-Buy-Hold/
If you have any more questions, please let us know so we can help you!
Carlos Z.
1 Like
From the example I can figure out the total amount invested $100k as $6864=6.84% (red=loss)

But I cannot figure out when the buy’n’hold begin. If I just look at the trades the initial investment (short)
was $9964 and the final close $8279
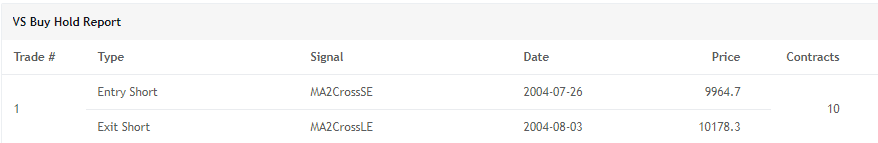
thus down 17% 1-(8279/9964)=0.169 but 6.84%???

I know banks used strange functions to calculate interest when you got any just to make it more or less impossible to track, but what is happening here?
My understanding of “buy and hold” vs “strategy” was: at day one I can either buy and hold or use my strategy. At the end I liquidate any open trade and then compare. But the numbers does not meet this idea. What did I misunderstand?
1 Like
I think I understand your point, it could be an error on the formula that tradingview use ?
My understanding on buy and hold is that every entry on the market is just to hold, so just count all the times your script entry in a position. (just buy for each entry).
Carlos Z.
1 Like