Reading Assignment: Strategy Improvements

Here is my strategy tested on three different data set.

First data set : - $137 (negative)

Second data set : $211(positive)

Third data set : -$97.2 (negative)

CODE
// This source code is subject to the terms of the Mozilla Public License 2.0 at https://mozilla.org/MPL/2.0/
// © Bluebits

//@version=3

strategy(title=“EMA & MA Crossover”, overlay = true, initial_capital=2000, commission_type=strategy.commission.percent, commission_value=0.2)

//DATE AND TIME
fromMonth = input(defval=2, title =" From month", minval=1)
fromDay = input(defval=15, title =" From day", minval=1)
fromYear = input(defval=2019, title =" From year", minval=2014)

toMonth = input(defval=5, title = “To month”, minval=1)
toDay = input(defval=15, title = “To day”, minval=1)
toYear = input(defval=2019, title = “To month”, minval=2014)

//DEFINITIONS
shortMa = ema(close, 7)
longMa = sma(close, 30)
r = rsi(close,14)

//LOGIC
timeInRange = (time > timestamp(fromYear, fromMonth, fromDay, 00, 00)) and (time < timestamp(toYear, toMonth, toDay, 23, 59 ))
longSignal = crossover(shortMa, longMa) and timeInRange
shortSignal = crossover(longMa, shortMa) and timeInRange

//POSITIONS
strategy.entry(id=“longPosition”, long=true, qty=0.1, when=longSignal)
strategy.entry(id=“shortPositon”, long=false, qty=0.1, when=shortSignal)

2 Likes

Honesty is Great , similar to how I’m doing it, I need more information

1 Like

Hourly candlestick
4 Hourly candlesticks
1 day candlesticks
ALOT of learning and work to do on this.

1 Like


*- BASIC DOUBLE MOVING AVERAGE *
- JAN 2019 - JUNE 2019
- $600 CAP w/ 2% commission
$18.50 PROFIT w/ 30%

*- BASIC DOUBLE MOVING AVERAGE *
- JAN 2019 - JUNE 2019
- $600 CAP w/ 2% commission
$195.77 PROFIT w/ 30%

1 Like

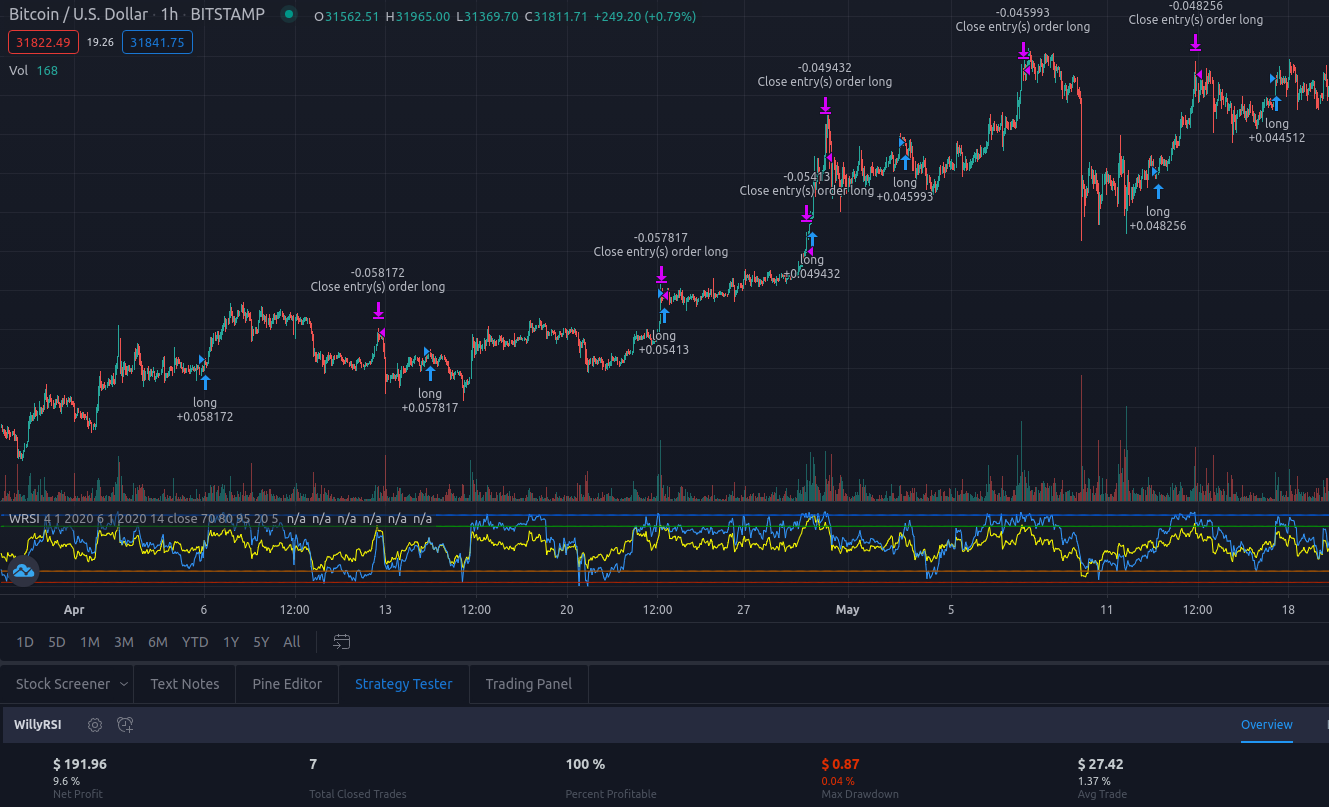
At first, I was reading about popular indicators and playing around with them. I noticed that if Willy and RSI are plotted on the same chart, their crossovers can produce quite valid signals. I also noticed that overbought and oversold, adjusted to the volatility, can indicate where a position should be closed.
The problem, though, was making it work for different data sets. I tried it on several which appeared to be similar, but what gave massive gains on one set generated loss on another.
Finally, this is the best I managed to make:

//@version=4
strategy(title="WillyRSI", shorttitle="WRSI", initial_capital=2000, default_qty_type=strategy.percent_of_equity, default_qty_value=20, commission_type=strategy.commission.percent, commission_value=0.2)

fromMonth = input (defval = 4, title = "From month", minval = 1)
fromDay = input (defval = 1, title = "From day", minval = 1)
fromYear = input (defval = 2020, title = "From year", minval = 2014)

toMonth = input (defval = 12, title = "To month", minval = 1)
toDay = input (defval = 1, title = "To day", minval = 1)
toYear = input (defval = 2020, title = "To year", minval = 2014)

timeInRange = (time > timestamp(fromYear, fromMonth, fromDay, 00, 00)) and (time < timestamp(toYear, toMonth, toDay, 23, 59))

len = input(14, minval=1, title="RSI length")
src = input(close, "Source", type = input.source)
up = rma(max(change(src), 0), len)
down = rma(-min(change(src), 0), len)
rsi = down == 0 ? 100 : up == 0 ? 0 : 100 - (100 / (1 + up / down))
plot(rsi, "RSI", color=#ffff00)

length = input (defval=70, title="Willy length")
willy = 100*(lowest(length) - close)/(lowest(length) - highest(length))
plot(willy, "Willy", color=#3399ff)

ob1 = input (defval=80, title="Green overbought")
ob2 = input (defval=95, title="Blue overbought")
os1 = input (defval=20, title="Orange oversold")
os2 = input (defval=5, title="Red oversold")
plot(ob1, color=#009900)
plot(ob2,  color=#005ce6)
plot(os1, color= #b35900)
plot(os2,  color=#b32400)

longEntry=crossover(willy, rsi) and timeInRange
longExit=crossover(rsi, ob1) and timeInRange
longExit2=crossover(rsi, ob1) and timeInRange

shortEntry=crossover(rsi, willy) and timeInRange
shortExit=crossover(os2, willy) and timeInRange
shortExit2=crossover(os1, rsi) and timeInRange

strategy.entry(id="long", long=true, when=longEntry or shortExit)
strategy.close(id="long", when=longExit or longExit2)

//strategy.entry(id="shortn", long=false, when=shortEntry or longExit)
//strategy.close(id="short", when=shortExit or shortExit2)

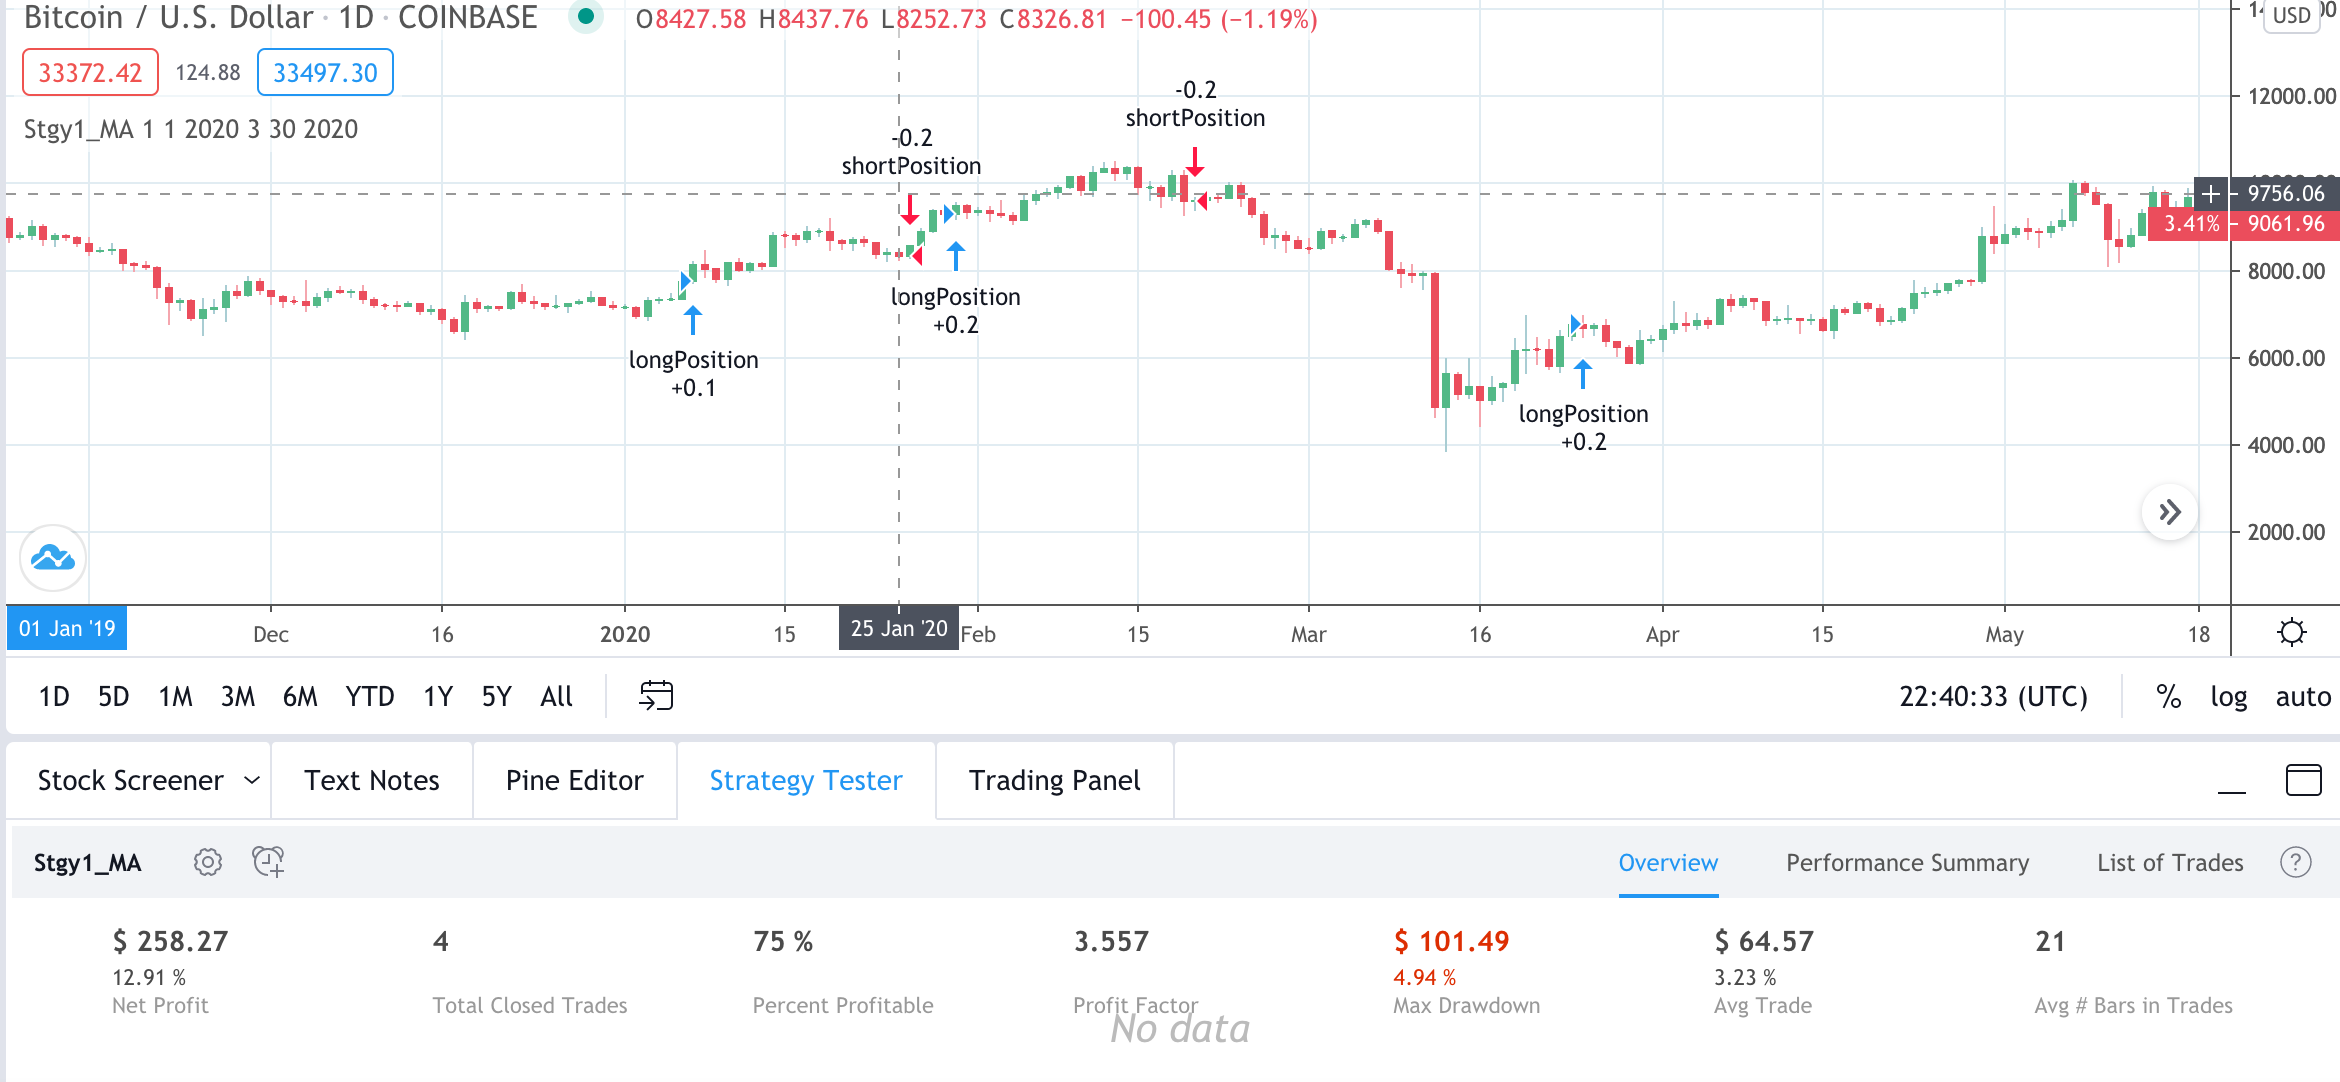
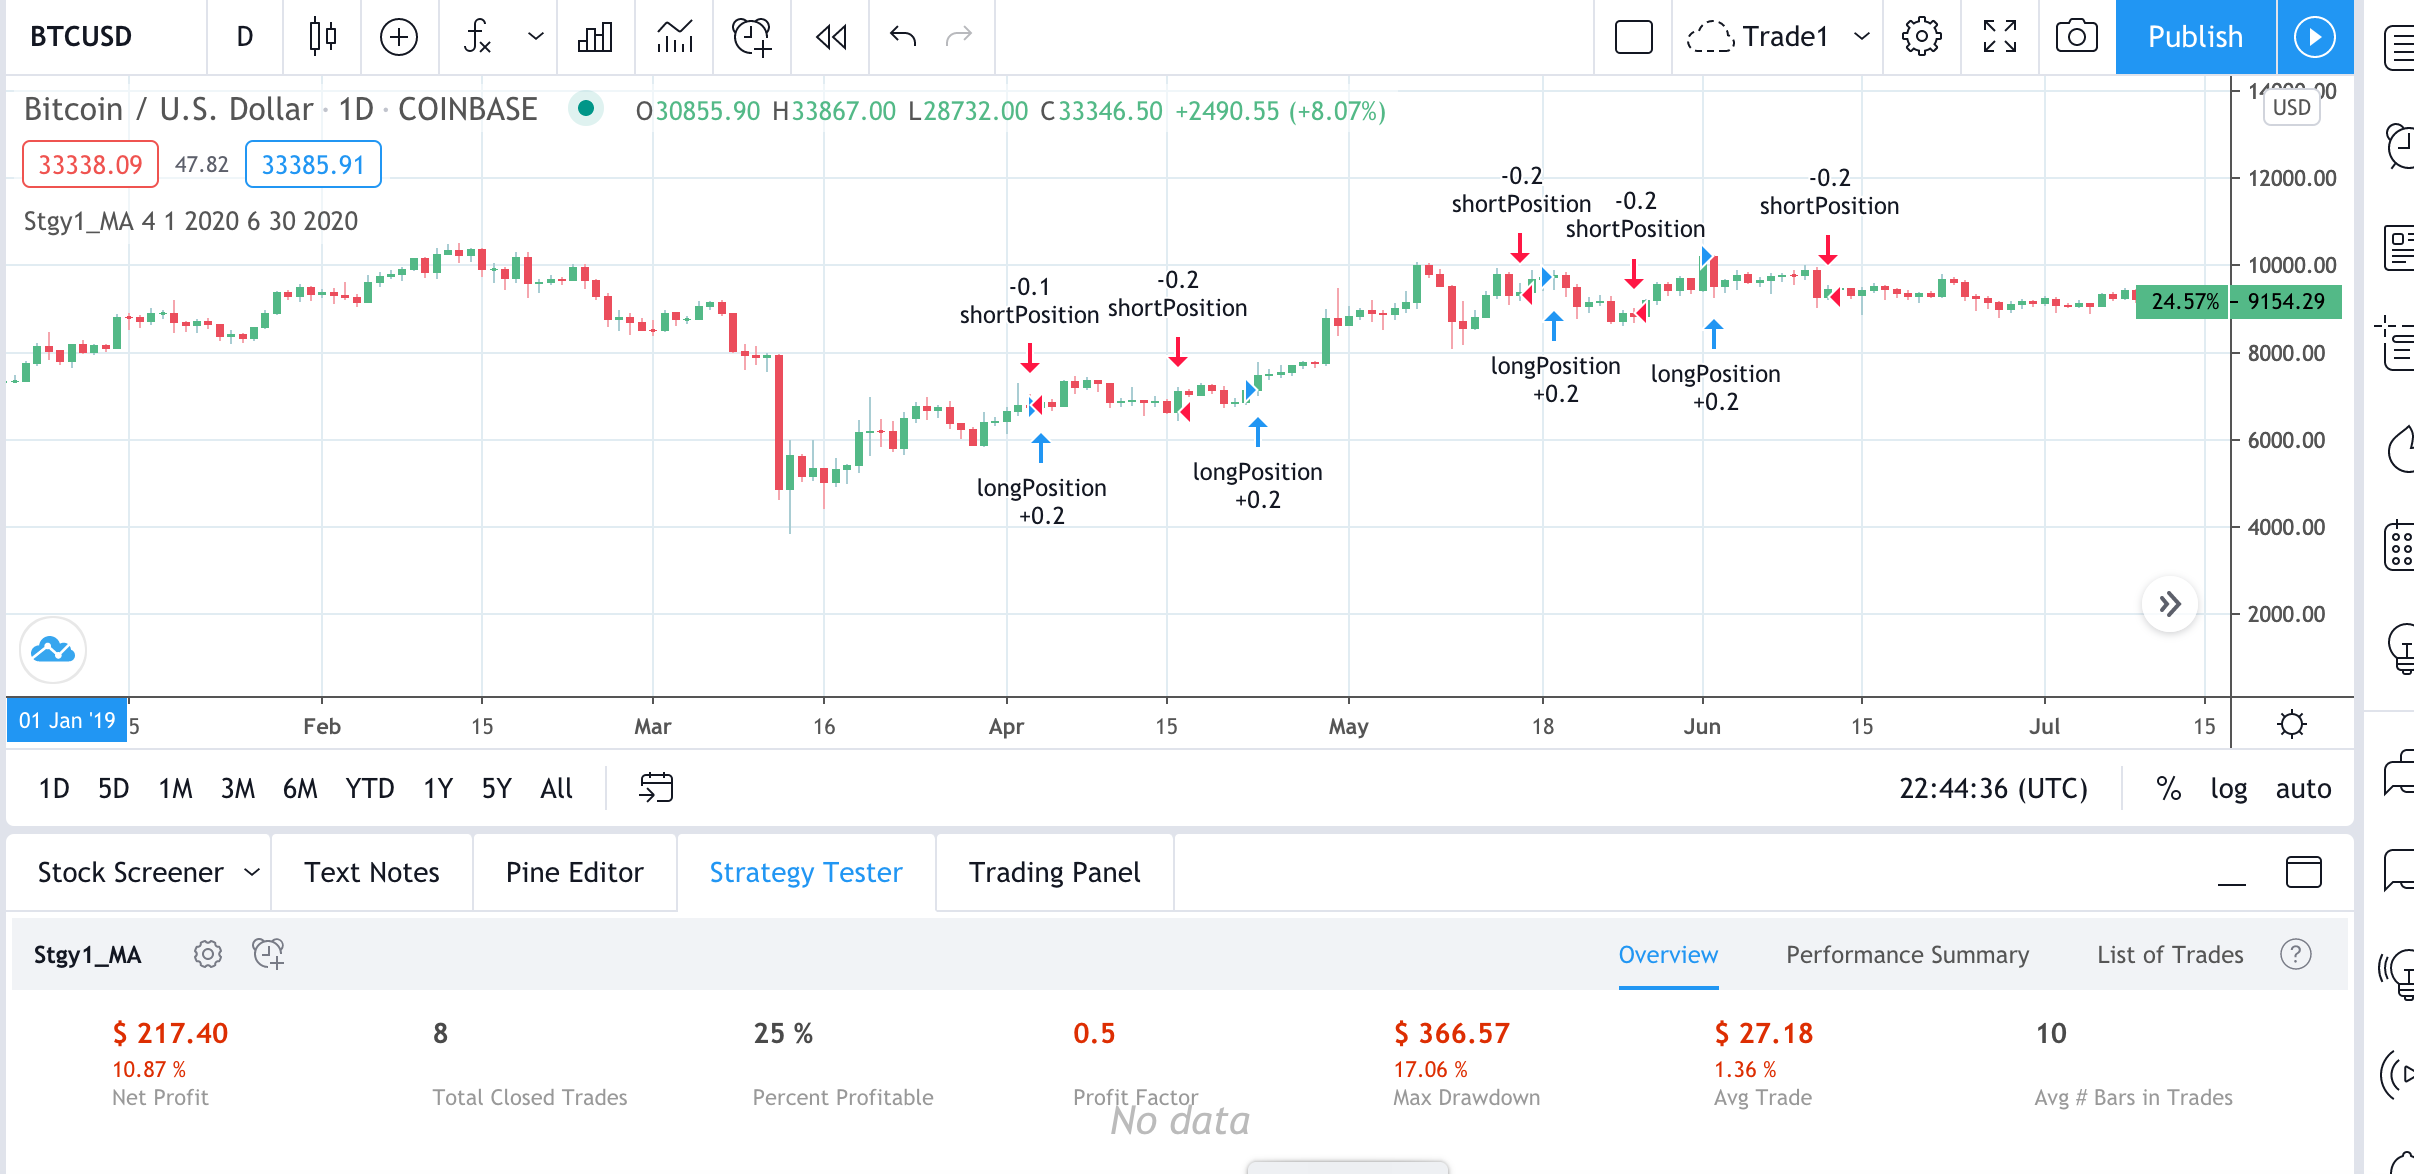
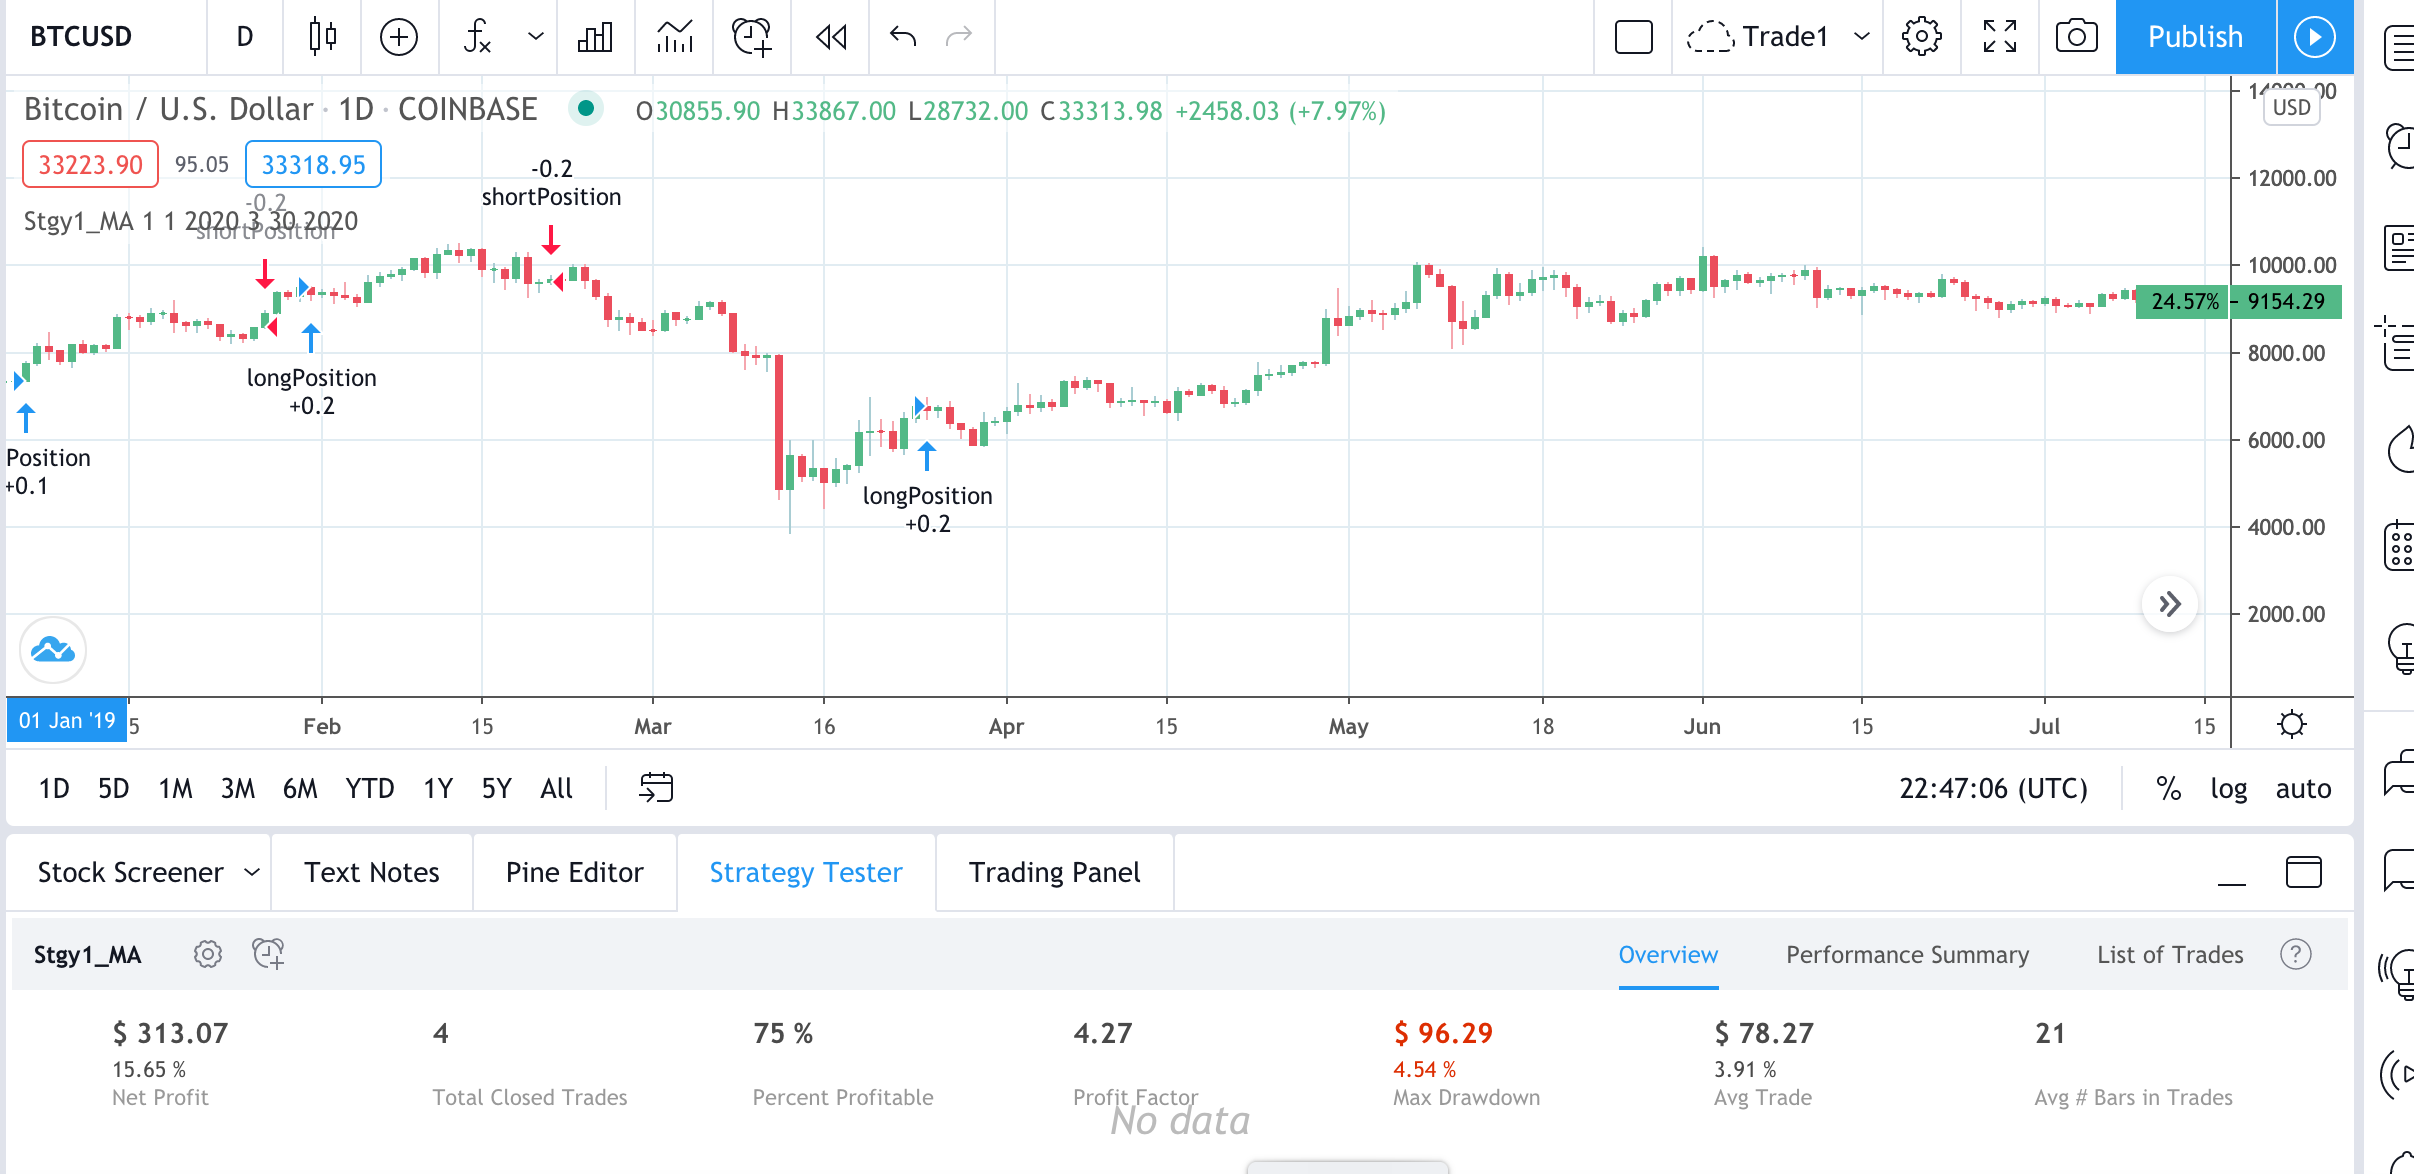
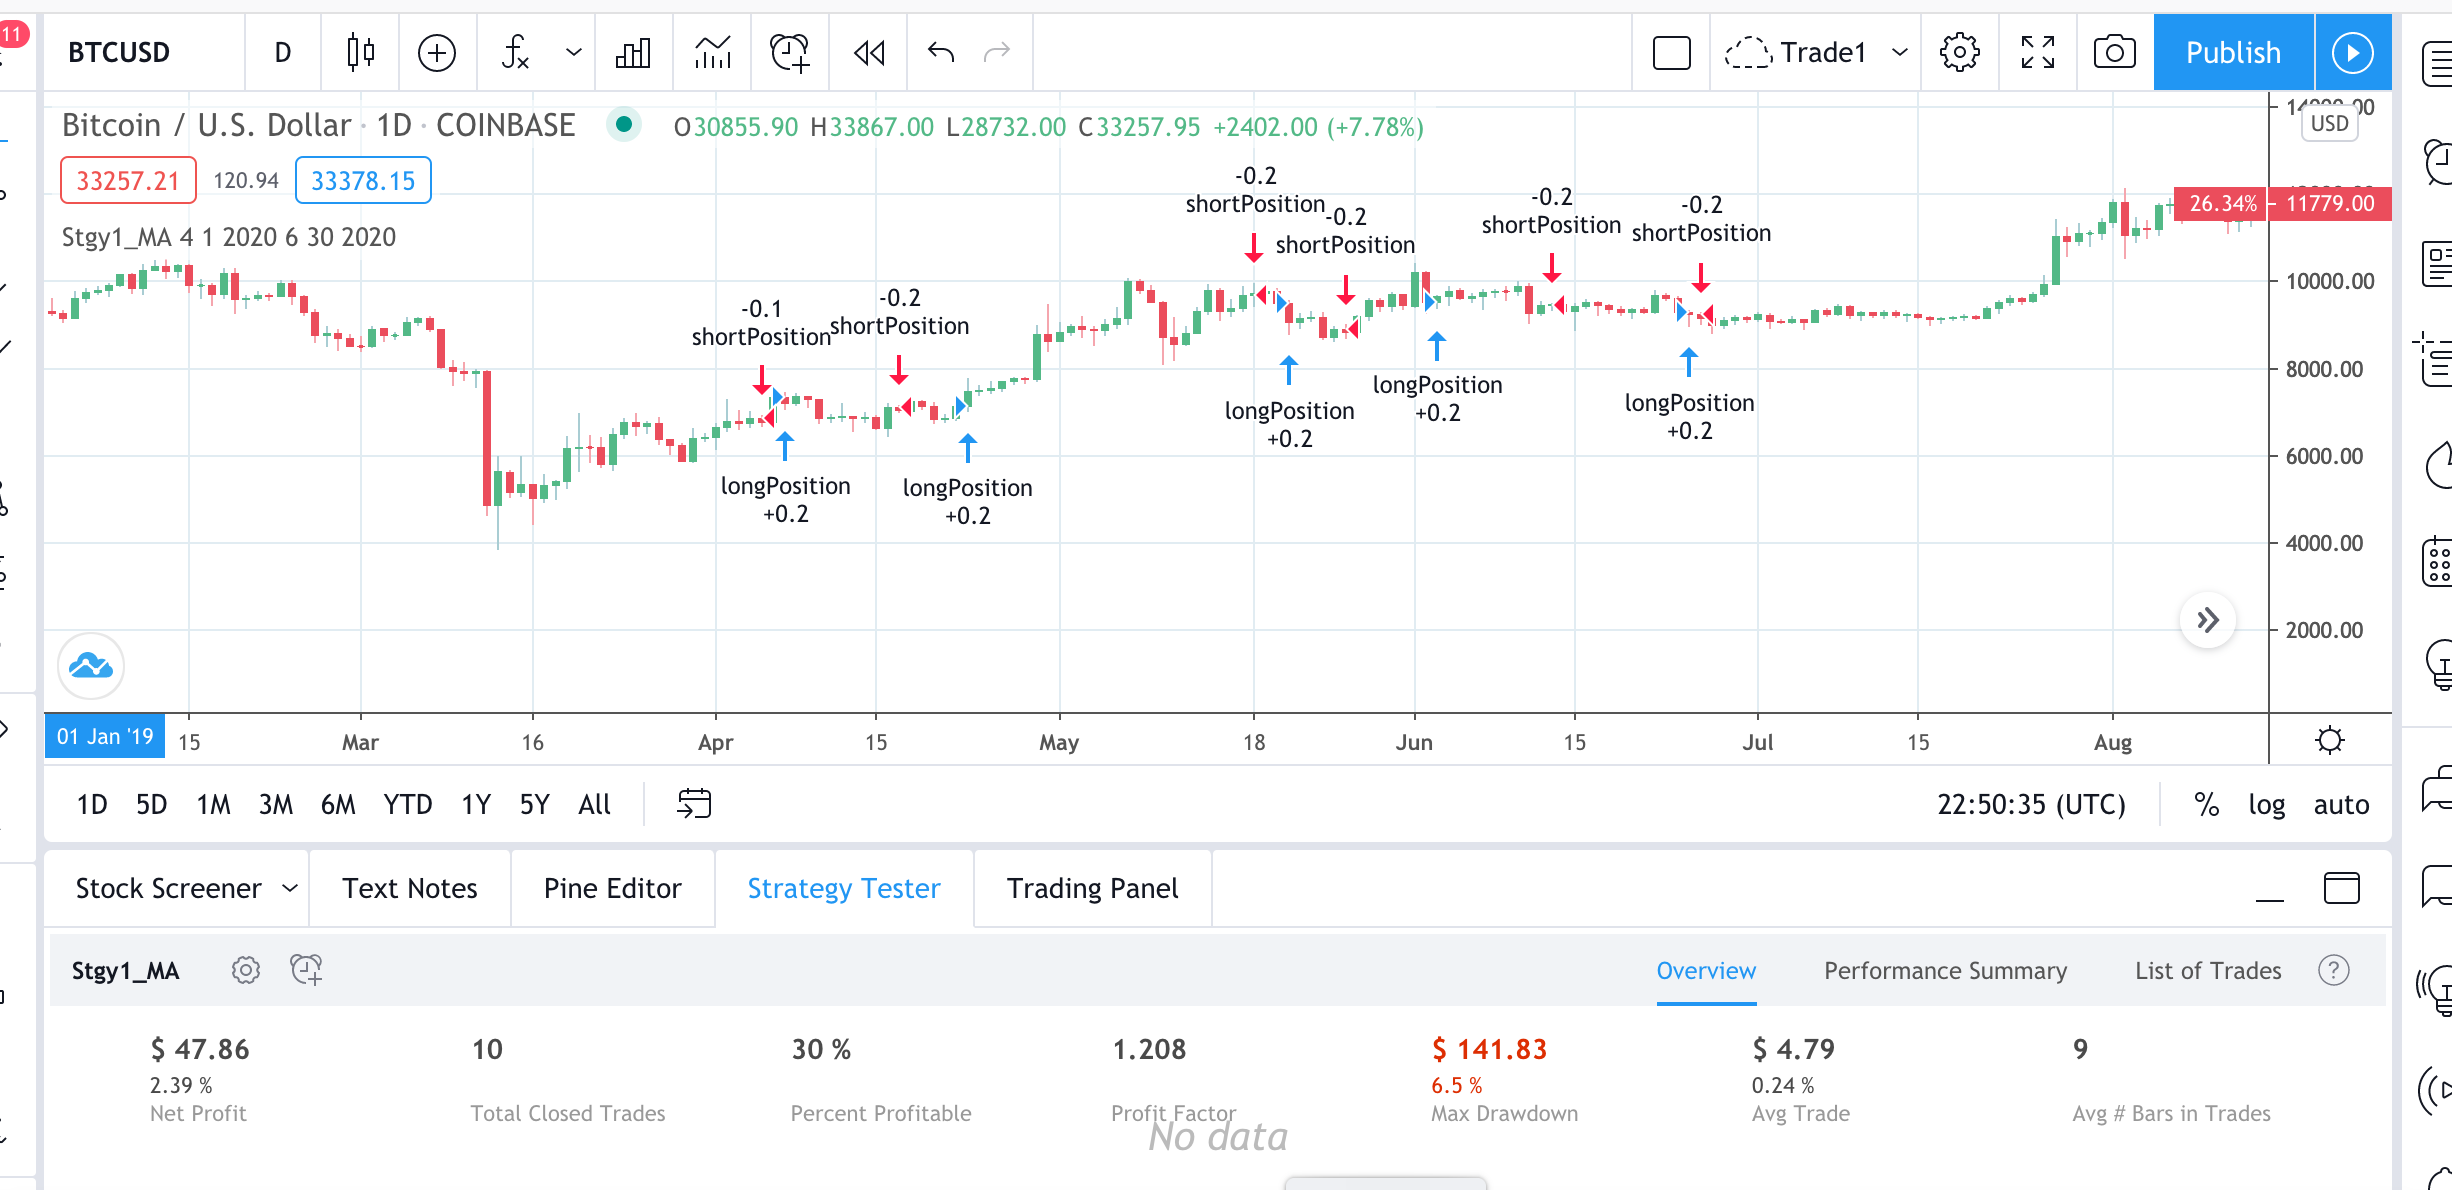
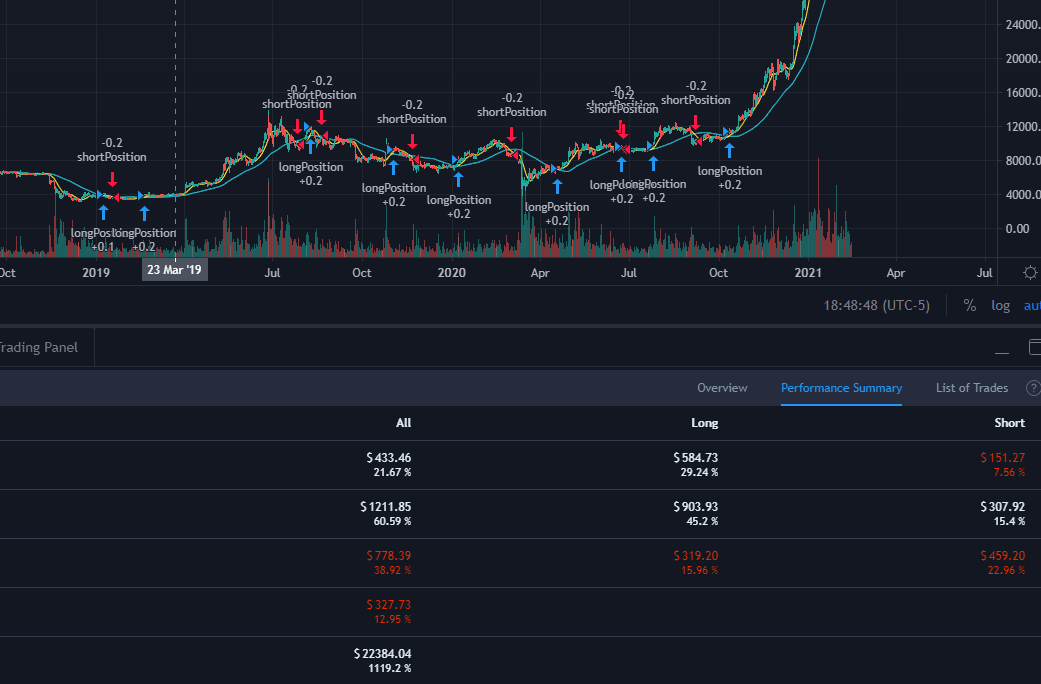
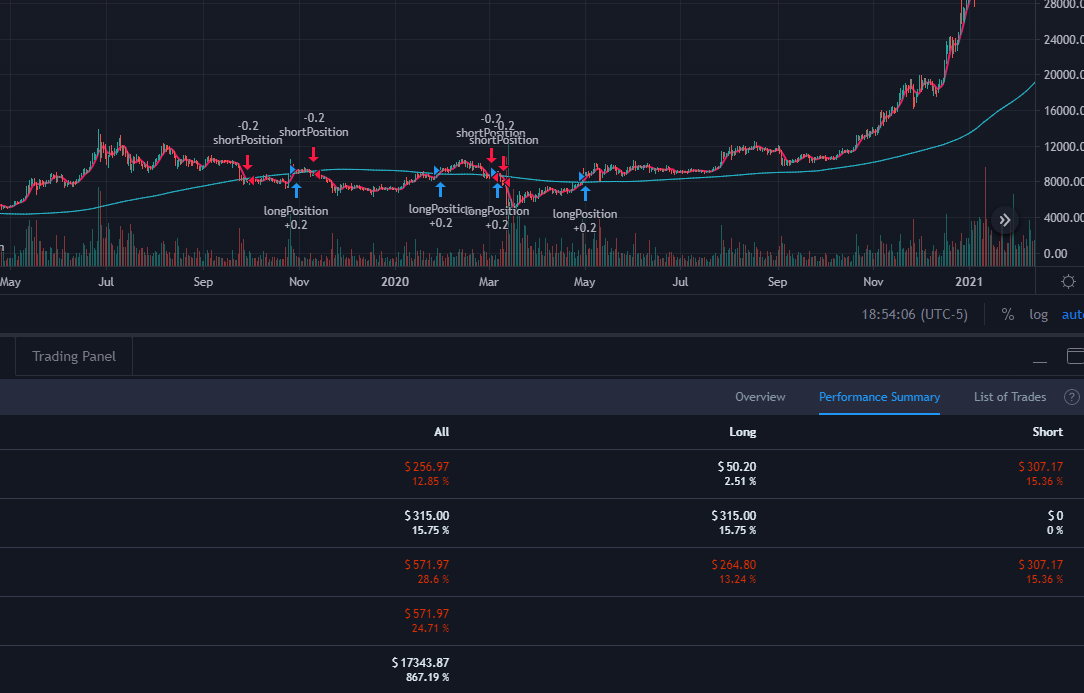
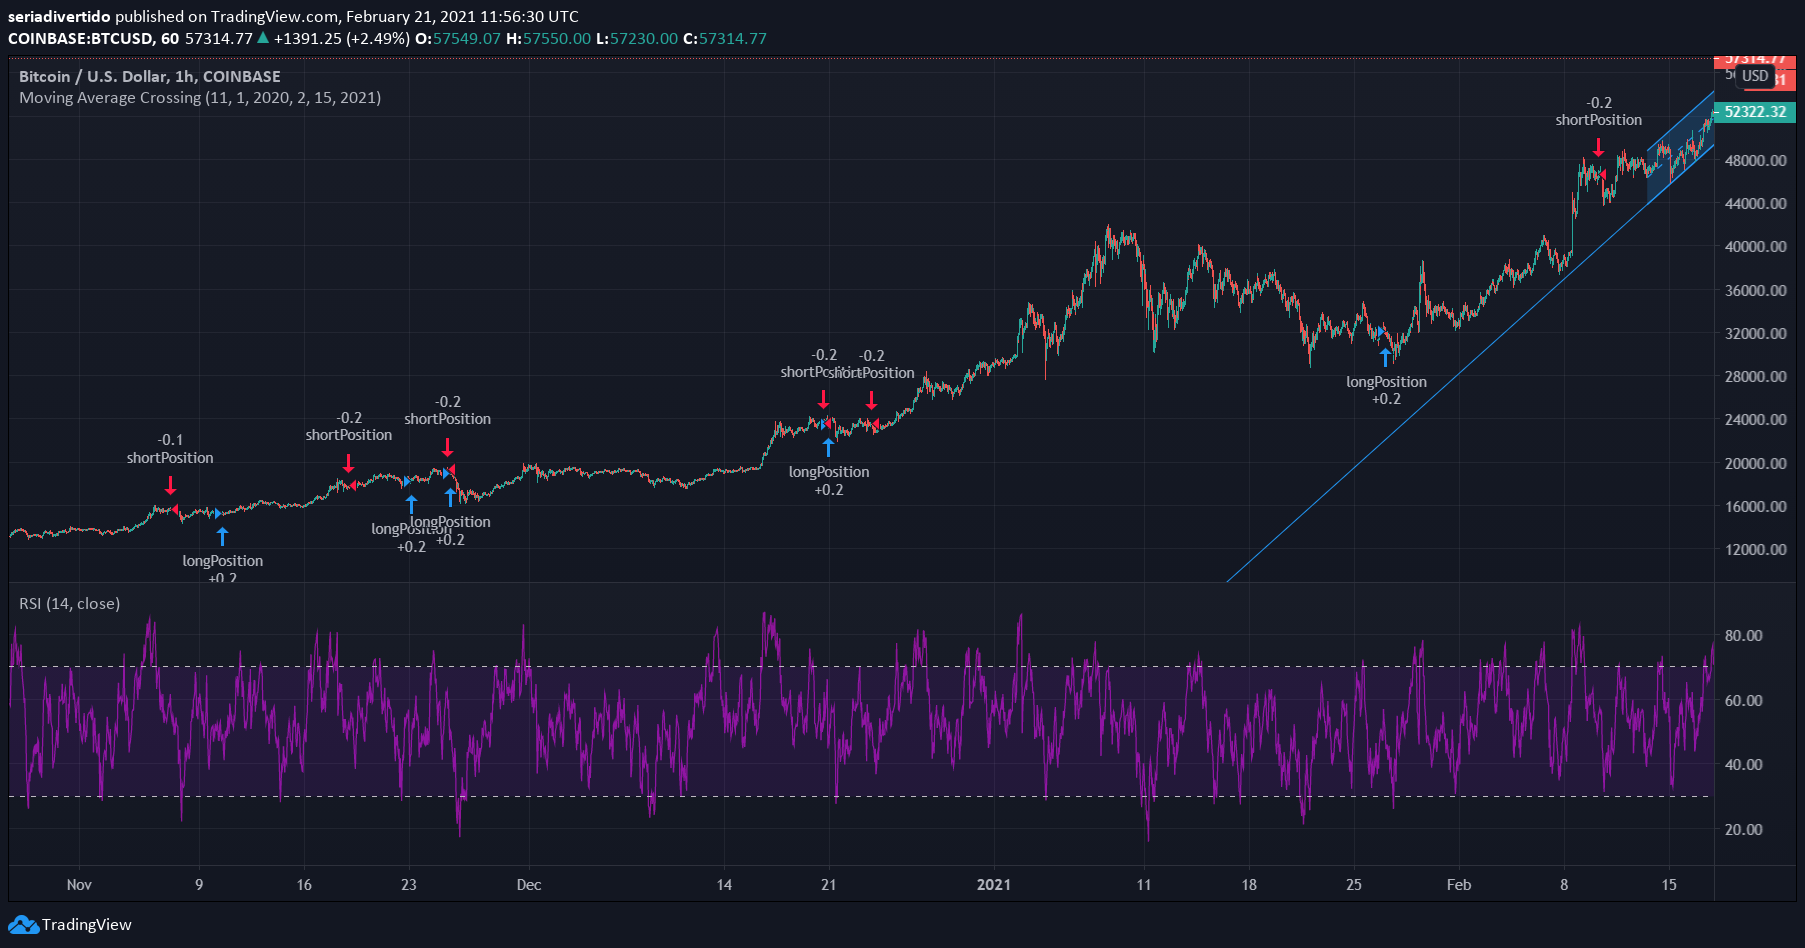
I tried to keep it symmetric, but the shorts kept reducing profits. So my idea is that in a general bull market only the longs should be opened, closed when overbought and then opened again. In a bear market that would be done only with shorts.

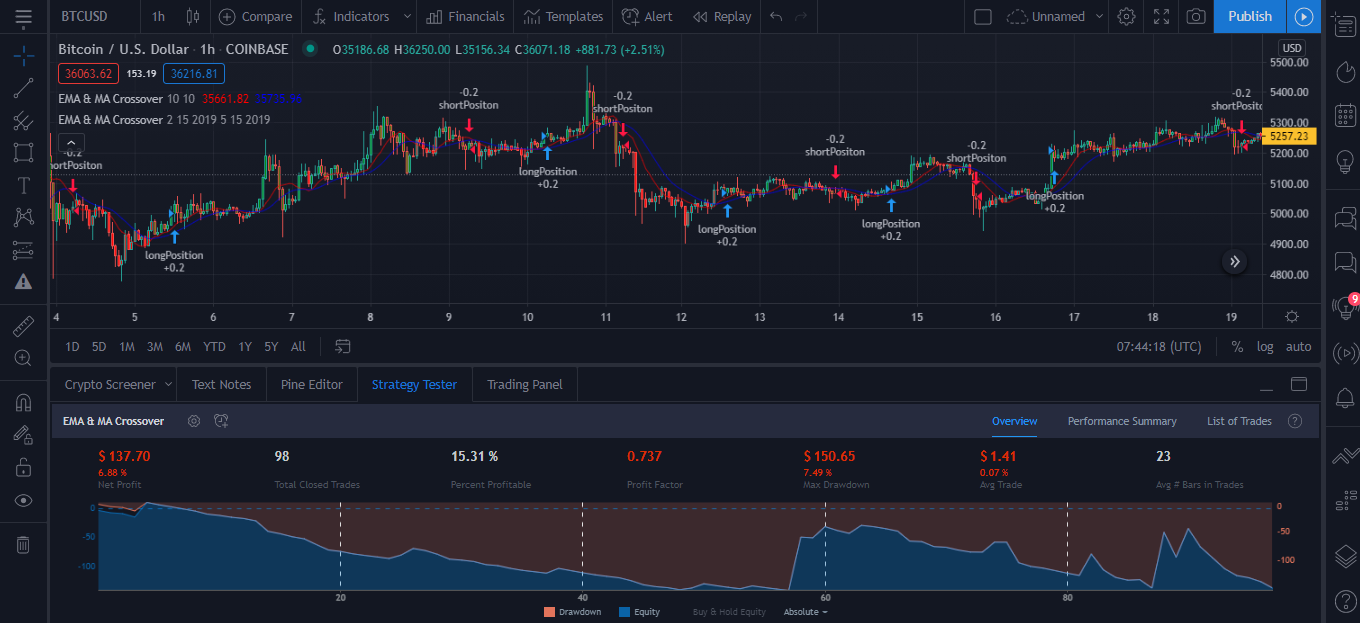
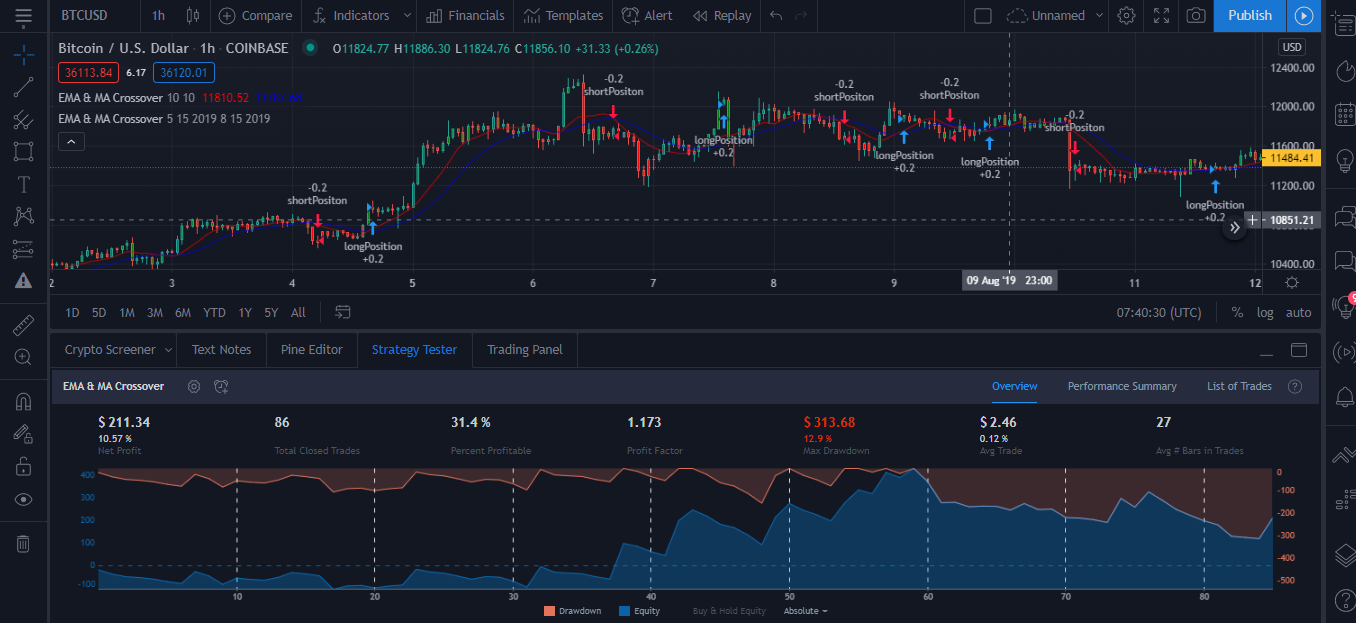
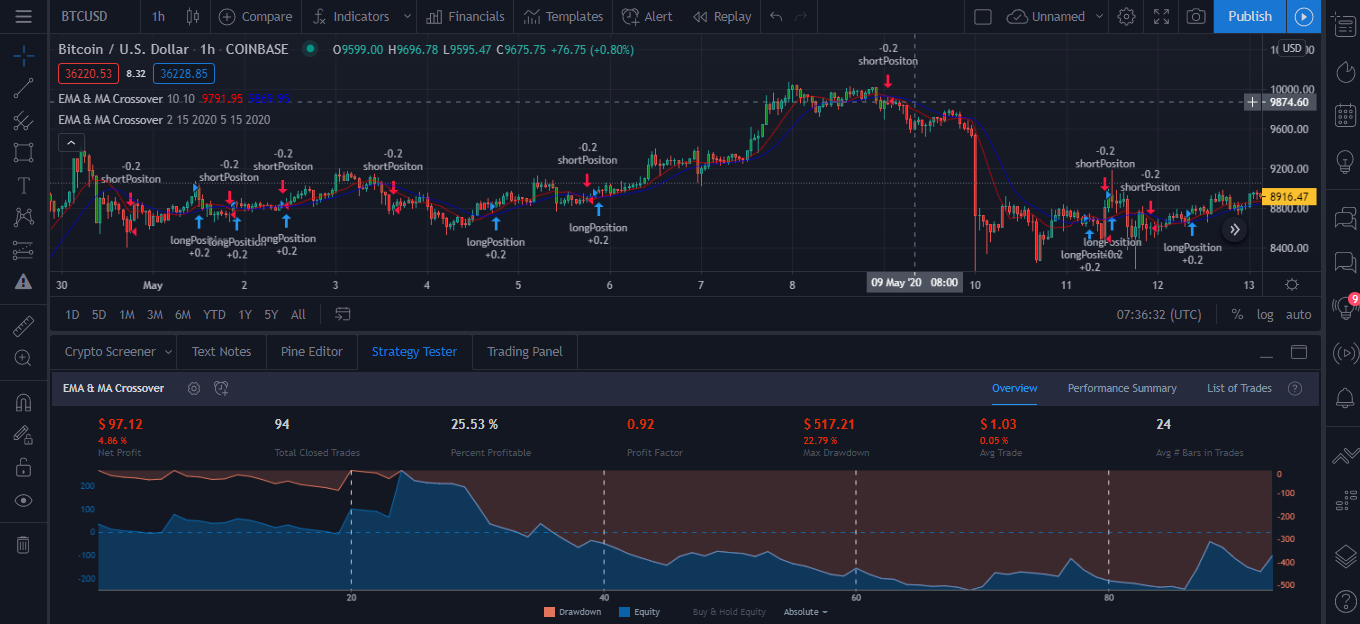
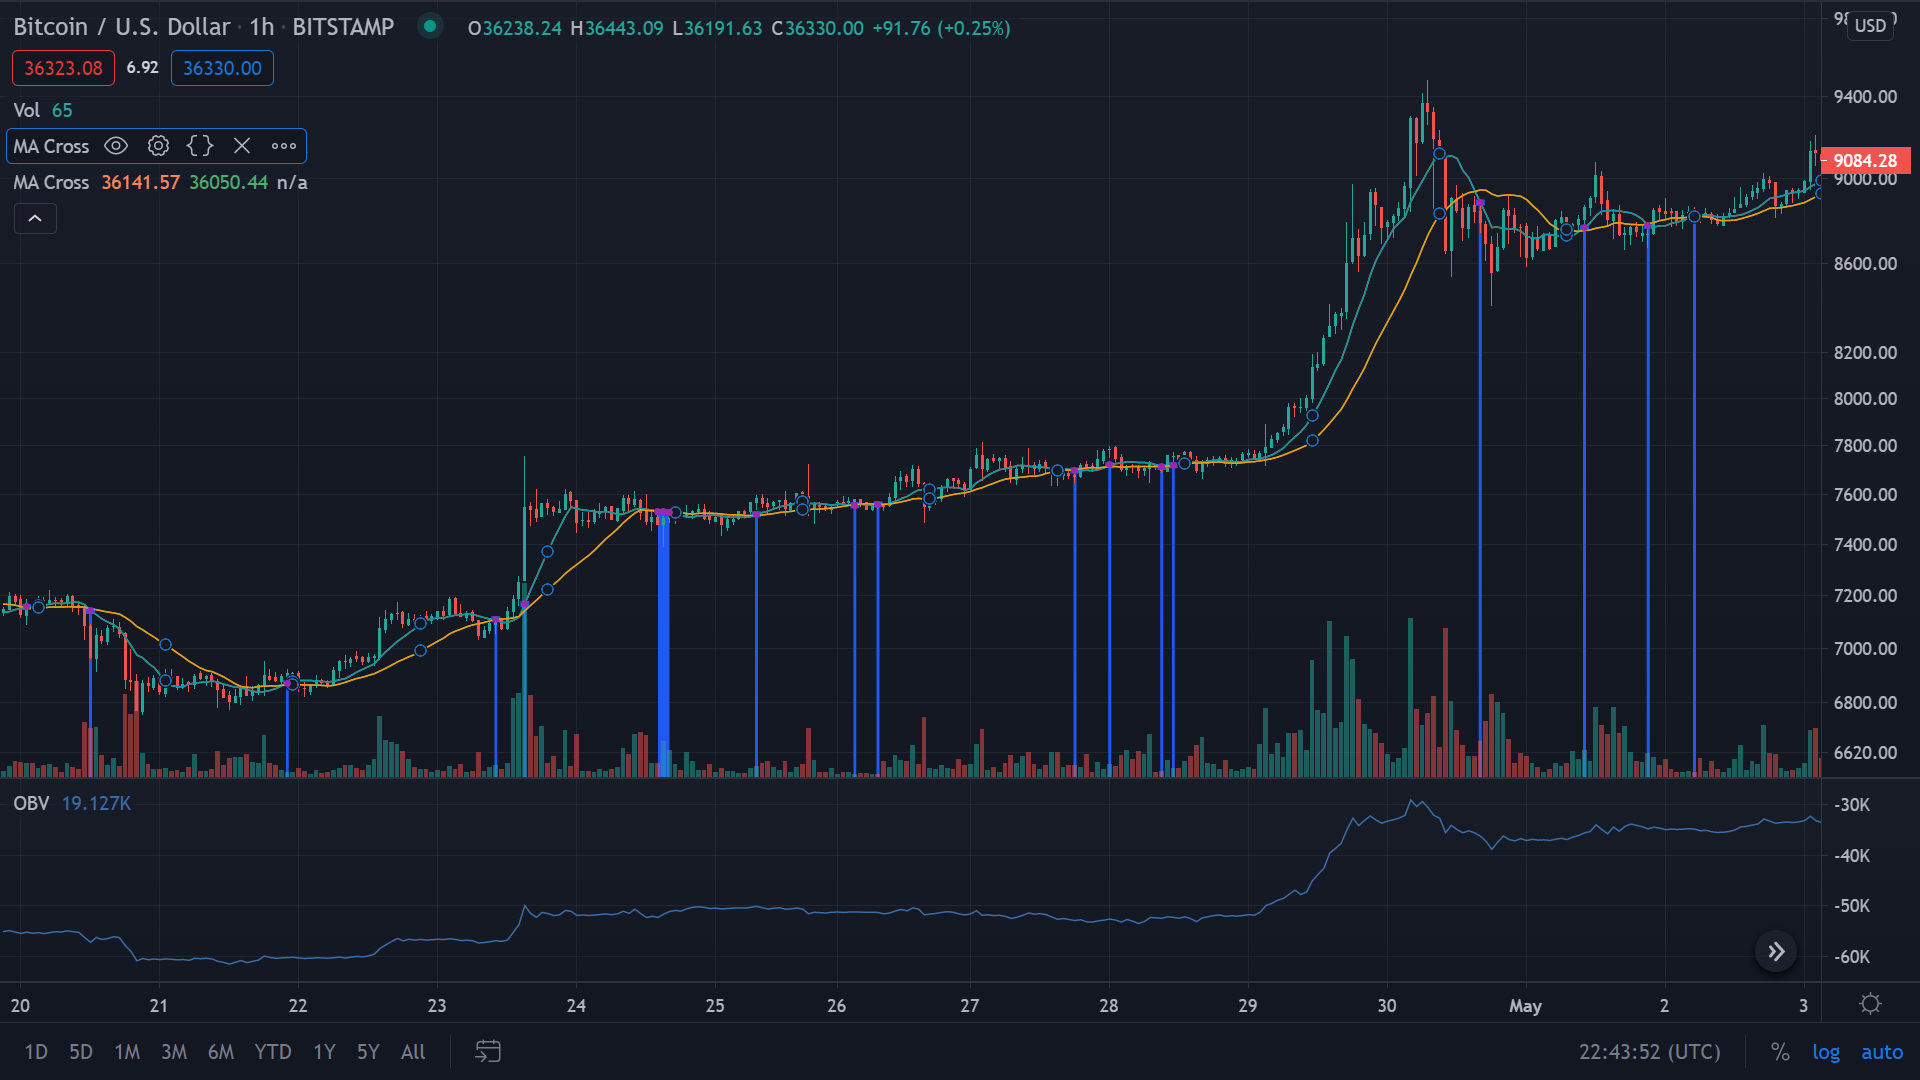
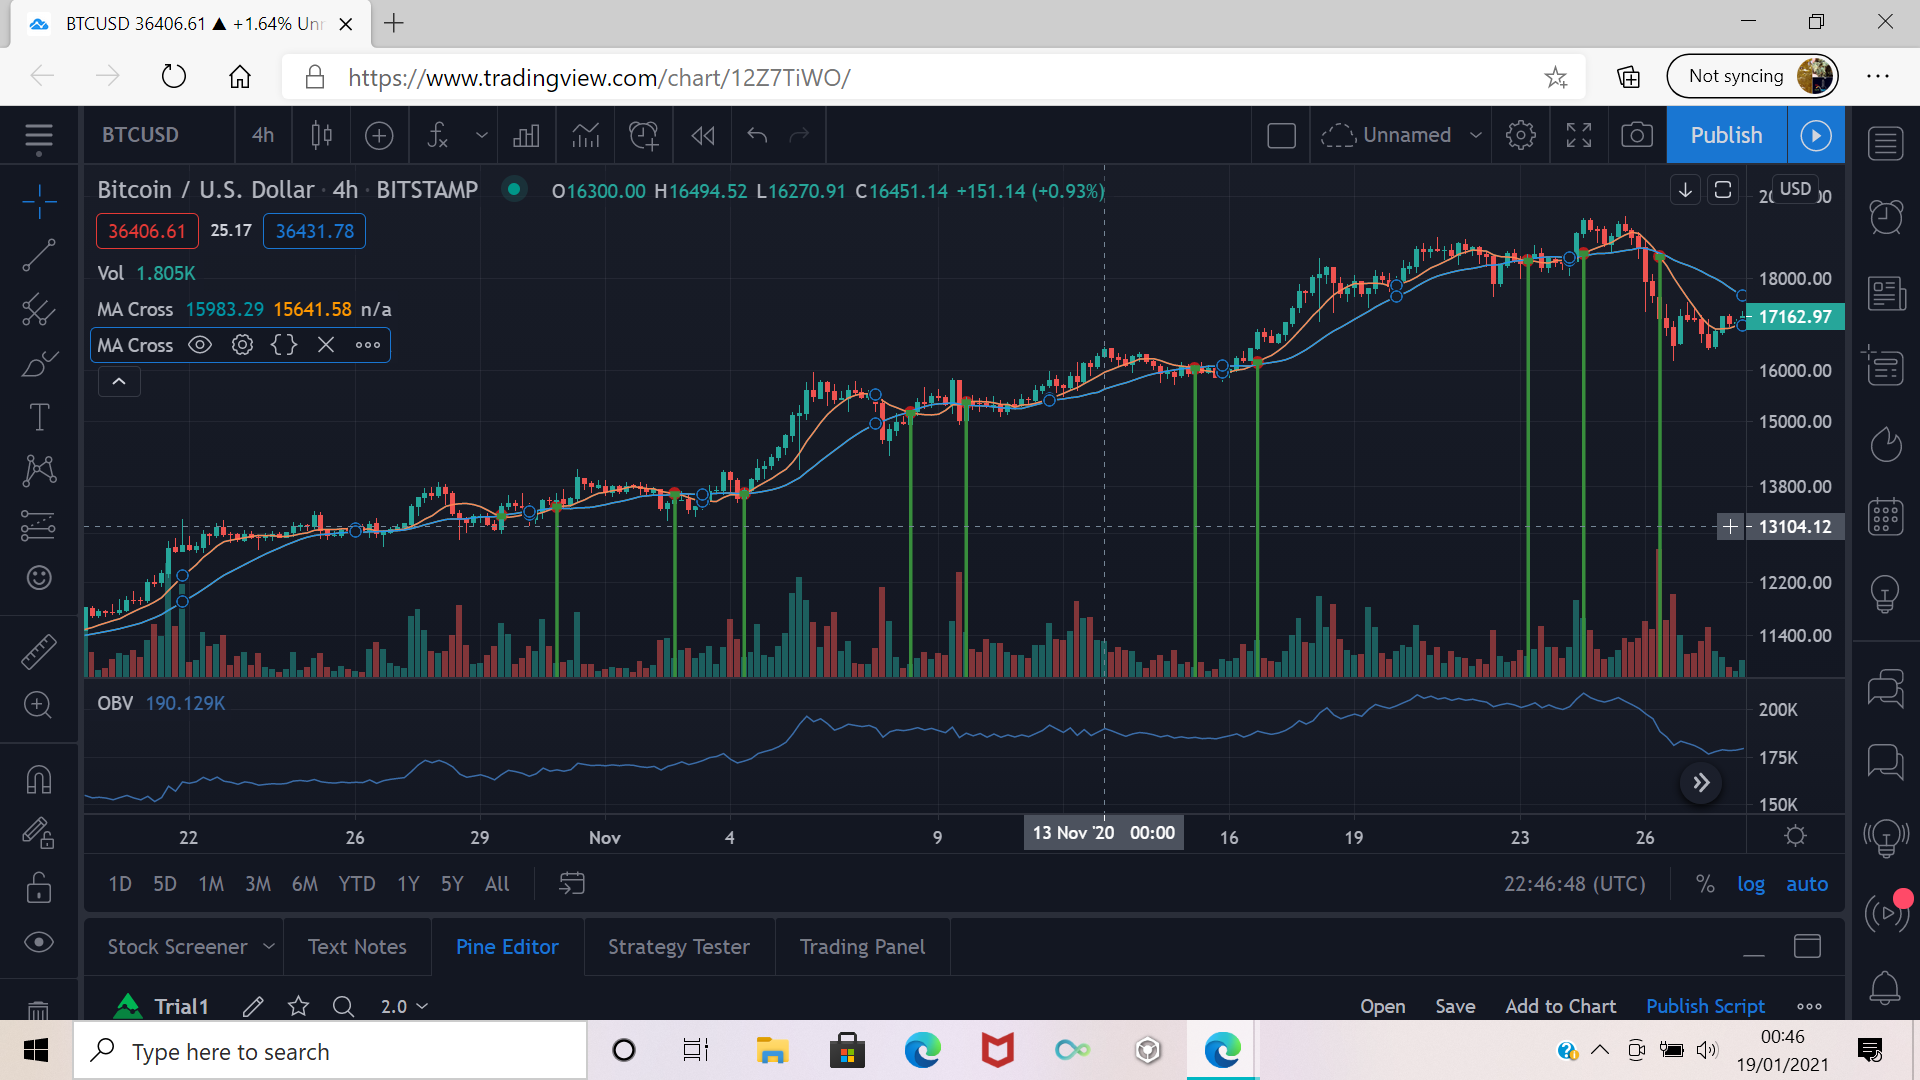
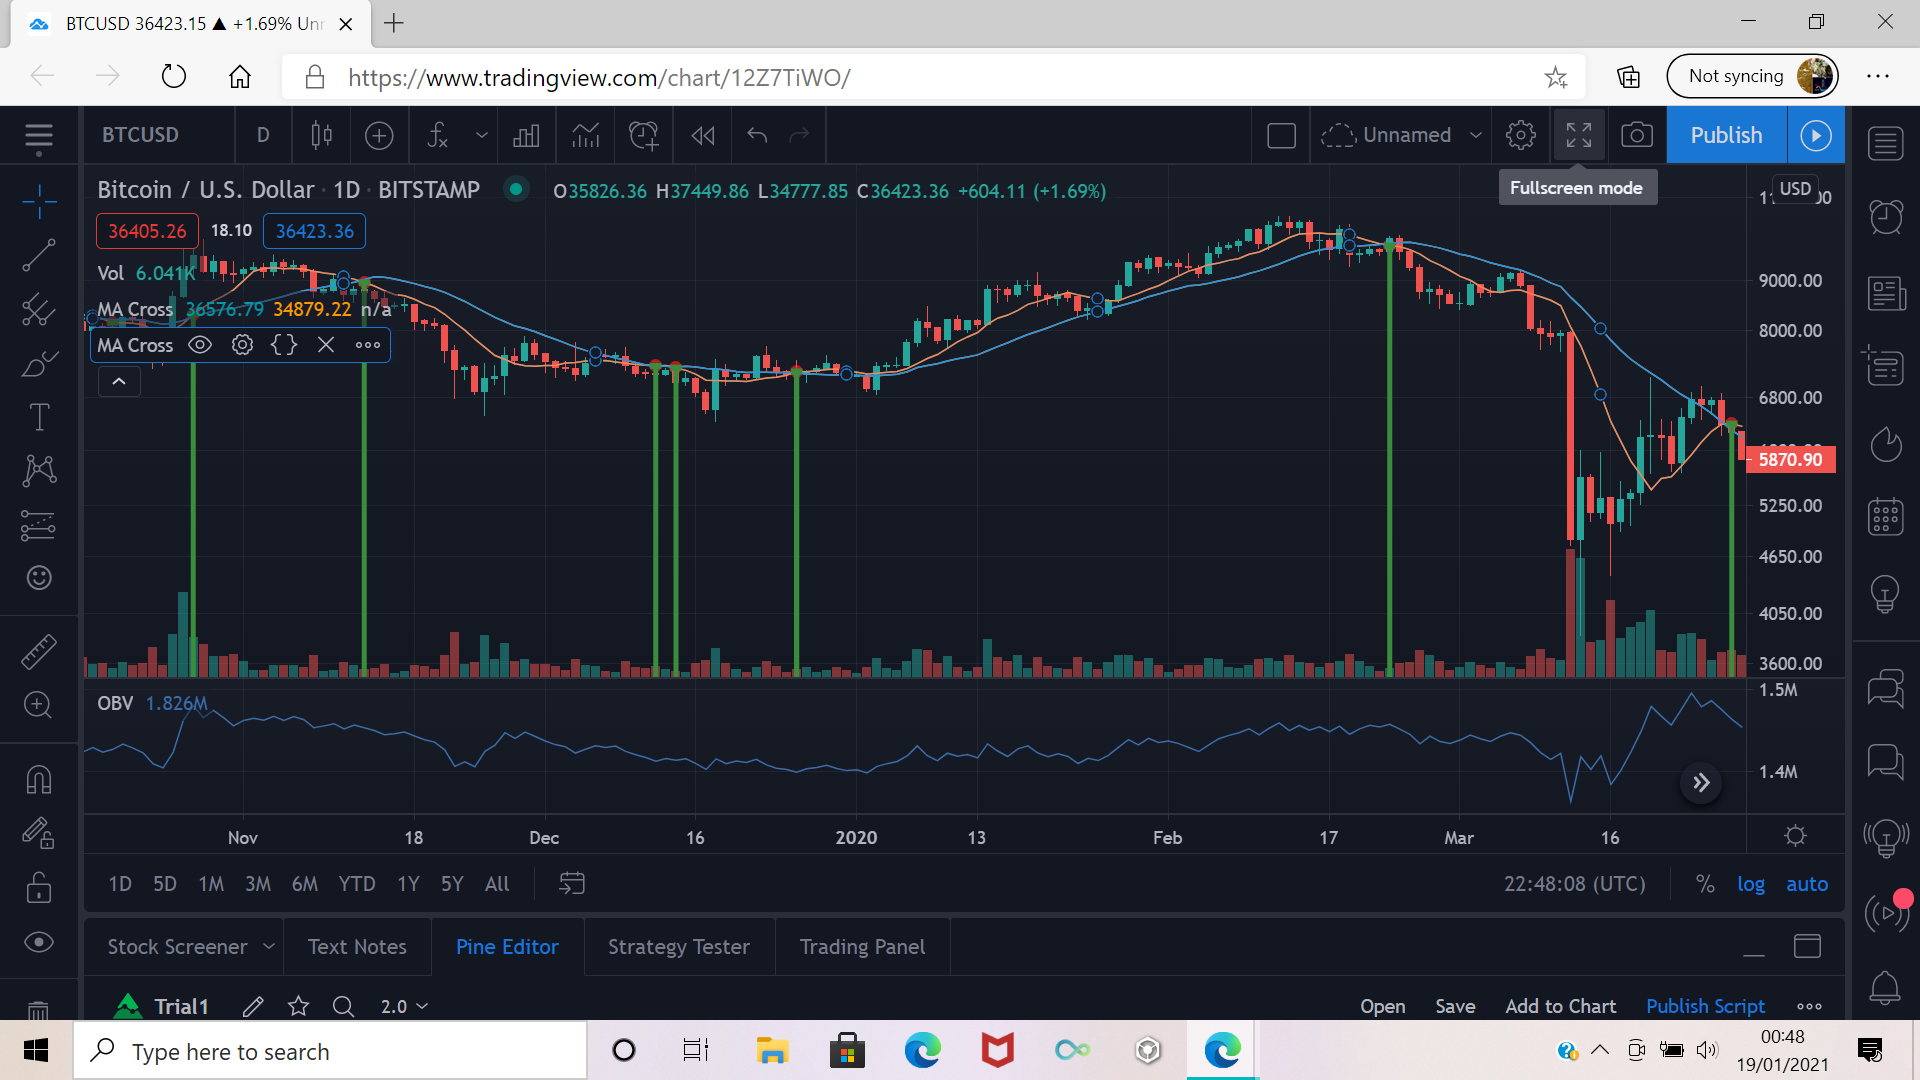
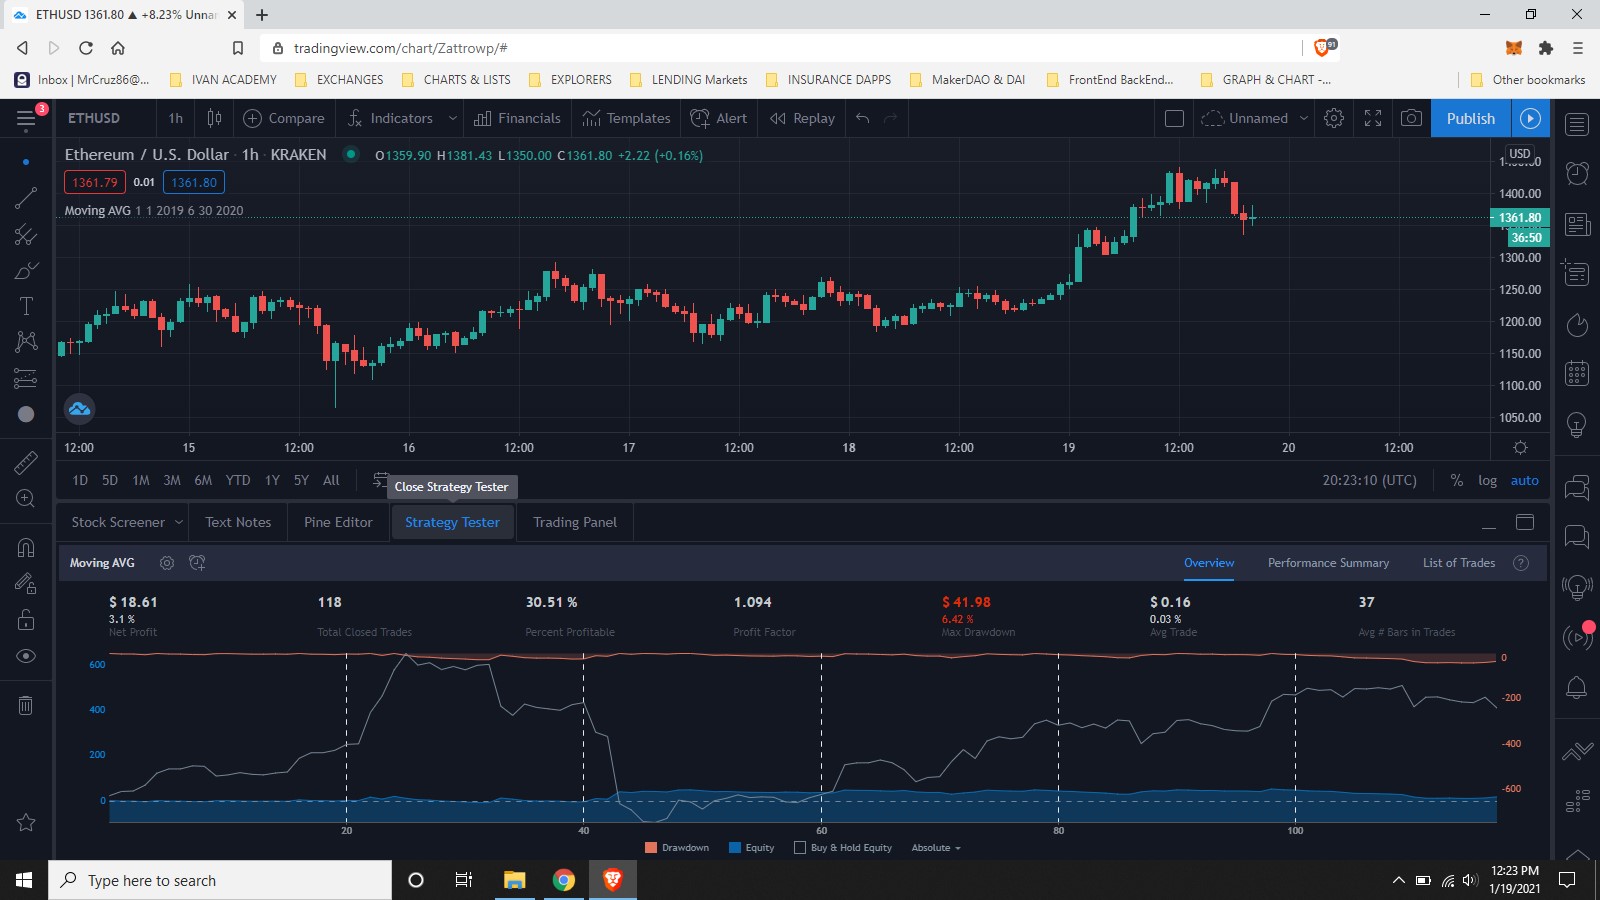
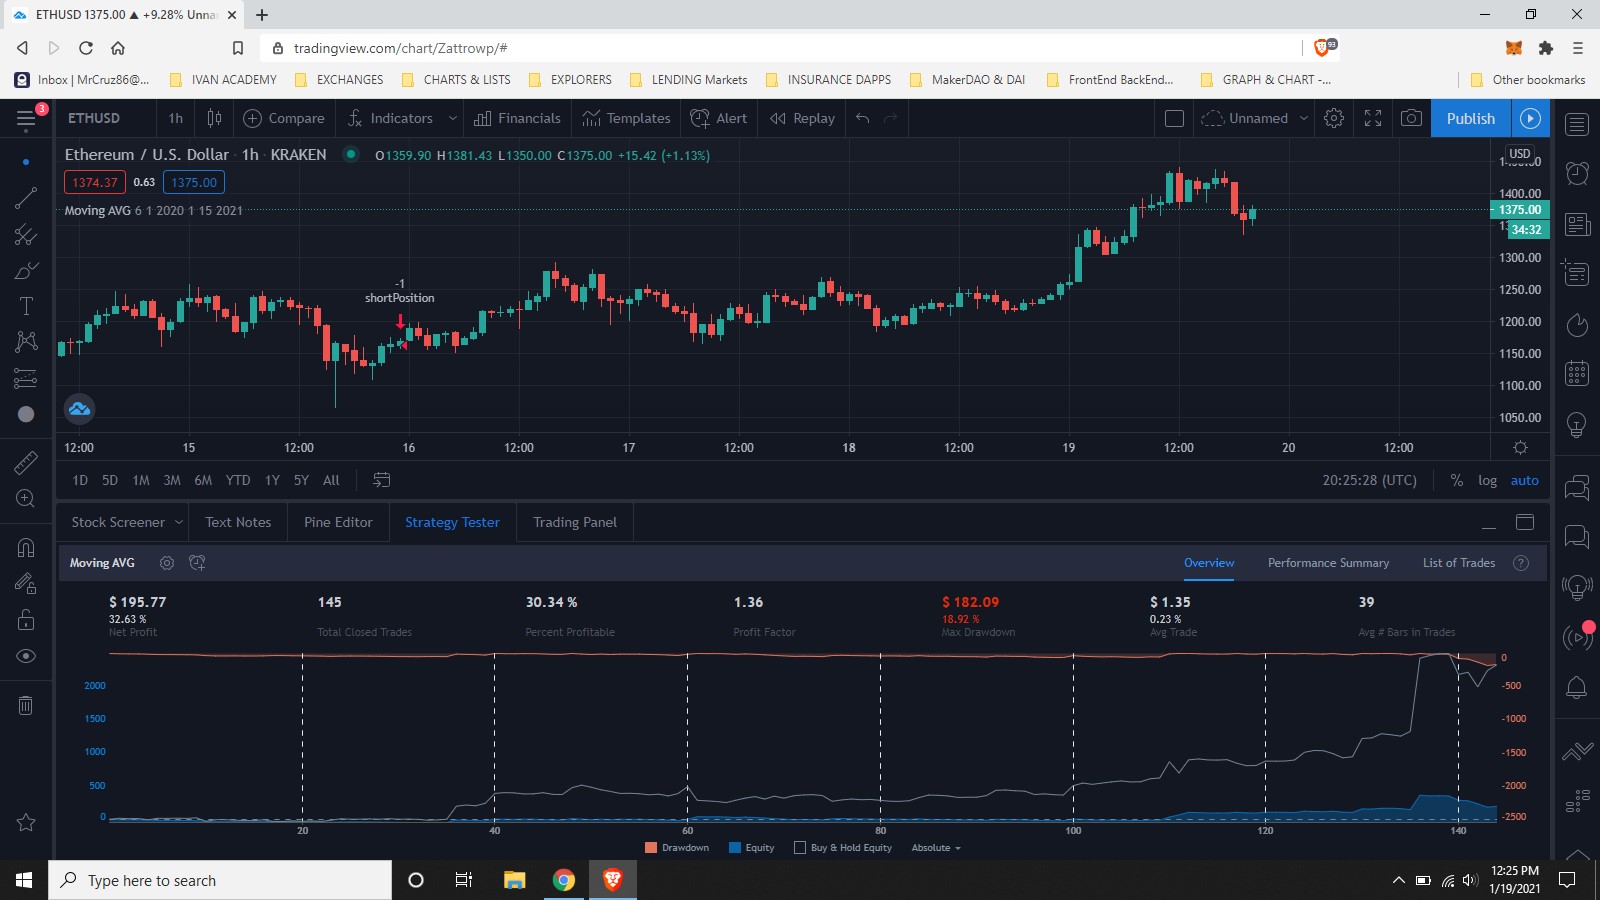
Here’s what it looks like on the chart:

3 Likes

I also noticed that, if you add the extra assumption about bull o bear market, the result improves notably. So I have some trouble keeping my strategy symmetric (maybe I am biased because we are in a bull market right now?).

1 Like

Strategy : short ma =7, long ma = 14, capital 2000, commission=0.2
Code:


//@version=4
strategy(title="Stgy1_MA", overlay=true, initial_capital=2000, commission_type=strategy.commission.percent, commission_value=0.2)

// date ant time

fromMonth=input( defval=1,title="From momth",minval=1)
fromDay=input(defval=1,title="From day",minval=1)
fromYear=input(defval=2020,title="From year",minval=2014)

toMonth=input( defval=3,title="To momth",minval=1)
toDay=input(defval=30,title="To day",minval=1)
toYear=input(defval=2020,title="To year",minval=2014)

// definitions
shortMA=sma(close,7)
longMA=sma(close,14)


// logic
timeInRange= (time > timestamp(fromYear,fromMonth,fromDay,00,00)) and (time < timestamp(toYear,toMonth,toDay,00,00))
signalLong=crossover(shortMA,longMA) and timeInRange
signalShort=crossover(longMA,shortMA) and timeInRange

//positions
strategy.entry(id="longPosition",long=true,qty=0.1,when=signalLong)
strategy.entry(id="shortPosition", long=false,qty=0.1,when=signalShort)


Data set 1: 1/2/2020 to 30/3/2020, profit: +12.91%

Data set 2: 1/4/2020 to 30/6/2020, profit: -10%

Back testing tweak: short ma =9, long ma = 14, capital 2000, commission=0.2

Data set 1: 1/1/2020 to 30/3/2020, profit +15.65%

Data set 2: 1/4/2020 to 30/6/2020, profit: +2.39%

Note: I tried adding some other indicators like MACD, RSI, but some how results got
worse or equal. Are there any other resources (reading,videos,etc) to know which indicators, in general, go well together? Because I feel is just “try and error”.

1 Like

My solution:

BTC / U.S. DOLLAR GEMINI:

BTC / U.S. DOLLAR BITSTAMP:

strategy(title ="Moving Average Crossing", overlay=true, initial_capital=2000, commission_type=strategy.commission.percent, commission_value=0.2)

maxDrawdown = input(defval = 10, title ="Max drawdown %")

strategy.risk.max_drawdown(value=maxDrawdown, type=strategy.percent_of_equity)

//DATE AND TIME
fromMonth = input(defval =1, title = "From month", minval=1)
fromDay = input(defval =1, title = "From day", minval=1)
fromYear = input(defval =2020, title = "From year", minval=2020)

toMonth = input(defval =1, title = "To month", minval=1)
toDay = input(defval =1, title = "To day", minval=1)
toYear = input(defval =2021, title = "To year", minval=2021)


shortMaCandles = input(defval=14, title="Short MA Candles")
longMaCandles = input(defval=90, title="Long MA Candles")

rsiCandles = input(defval=21, title="RSI Candles")

//Definitions
shortMa = sma(close, shortMaCandles)
longMa = sma(close, longMaCandles)
r = rsi(close, rsiCandles)

longWhenRSIVolume = input(defval = 30, title ="Long when RSI Volume")
shortWhenRSIVolume = input(defval = 30, title ="Short when RSI Volume")


//LOGIC
timeInRange = (time > timestamp(fromYear, fromMonth, fromDay, 00, 00)) and (time < timestamp(toYear, toMonth, toDay, 23, 59))
longSignal = crossover(shortMa, longMa) and timeInRange and r > longWhenRSIVolume
shortSignal = crossover(longMa, shortMa) and timeInRange and r < shortWhenRSIVolume  


//POSITIONS

strategy.entry(id="longPosition", long=true, qty=0.1 ,when=longSignal)
strategy.entry(id="shortPosition", long=false, qty=0.1 ,when=shortSignal)

Added a risk drawdown and played around with the RSI and SMA indicators and this was the best I could get. It is quite challenging to have a high enough risk factor with an average 40% percent profitable rate while outperforming a HODL strategy.

These statistics can only be taken with a grain of salt considering it could be very different in a bear market or even in a longer time period. Unfortunately free account does not allow for me to test on data previous to 2020 at the time of writing.

1 Like

its trash.
many * signs is missing.

Very interesting assignment. I’m somewhat limited with data sets because of using free TradingView version. Played around with some simple SMA combinations like Filip did at the beginning of this course and that seemed to work well and produced some good results. It gets worse quickly when you try to add more parameters and try to make it too complicated. I learned a lot from Filip when he said that these types of trading algorithms need a lot of testing and tweaking and even when you get something working you need to constantly keep adjusting it because markets and conditions change over time and are never the same. Filip proceeded to say he is therefore more of a HODLer type and I can only appreciate this honest statement.

I have to admit that it is hard to come up with some good results here. My compliments to all the people in this thread that have put in some great effort to produce a great algorithm.

My conclusion for now is that it is very hard to beat „fundamentals and pumpamentals“ and doing a little bit of research in these areas and doing a bit of HODLing from time to time seems to produce some very good results too. The best trading algorithms are very hard to come by and need a lot of constant attention. These trading algorithms are some of the most highly coveted pieces of code that can only be afforded by larger corporations or are produced by some of the smartest coding professionals.

I would therefore be more inclined to use some already existing trading bots like mentioned in these three trading bot articles below. It would save a lot of time and effort. The use of these types of trading bots might also be a good idea for a future course in the Ivan on Tech Academy.

For now I will continue with the course and try to get as much insight as possible about trading algorithms. It is a valuable lesson learned so far. Many thanks to Filip and Ivan for this course.

https://bravenewcoin.com/insights/cryptocurrency-trading-bots

https://bravenewcoin.com/insights/cryptohopper-launches-one-of-a-kind-a-i-feature-designed-to-automatically

https://captainaltcoin.com/best-bitcoin-trading-bots/

2 Likes

Will do it, but unfortunately, my Trading View gives an error with the code which is correct as I have checked it. Before fixing it cannot continue:(

I posted it to you earlier @filip

1 Like

Hey @Korpelanvoima, hope you are ok.

Could you please let me know where you share your code? I can help you solve the issue so you can continue your course :nerd_face:

If you have any more questions, please let us know so we can help you! :slight_smile:

Carlos Z.

1 Like

Since I misspelled one letter it did not work, as you wrote earlier. Now I fixed it and it works. Thank you.

1 Like

Utilising SMA 10 and 20
from 1/1/19 to 1/1/21
$383 profit - 95,75% net profit - 1025 trades - 1.448 PF - qty: 0,01btc - commission 0,2%
from 1/1/18 to 1/1/19
$36,9 profit - 9,23% net profit - 18 trades - 1.686 PF - qty: 0,01btc - commission 0,2%

//DEFINITIONS
shortMa = sma(close, 10)
longMa = sma(close, 20)

1 Like

I cant figure out what your saying! could someone pls tell me what to do???

what do you mean “outproforms me” like outfroforms the ‘buy and hold’ algorithm?
if so, i did it:

Tried the example with 10day MA and 50MA


first results in profit but looks like buying and holding is better.

Second twaek 5day MA and 200MA (wouldn’t recommend lol)

Also full disclosure was trying to code while Filip was doing it but kept getting weird errors so ended up copying and pasting using someone else code from this forum and doing the tweaks

1 Like

I’m excited to learn how to do exactly what i’d like to do, but i’m having trouble as i’m very new to programming and still new to trading. I have ideas based on indicators i use, but i’ll have to work on it more. For now, here’s small tweaks to what you gave us in class. I just used 100 and 200 MA.

Percent profitable - 72.73
Profit factor - 42.7

//@version=3

strategy(title=“Moving Average Crossing”, overlay=true, initial_capital=10000, commission_type=strategy.commission.percent, commission_value=0.2)

//DATE AND TIME

fromDay = input(defval=9, title = “From day”, minval=1)

fromMonth = input(defval=20, title = “From month”, minval=1)

fromYear = input(defval=2011, title = “From year”, minval=2011)

toDay = input(defval=1, title = “To day”, minval=1)

toMonth = input(defval=4, title = “To month”, minval=1)

toYear = input(defval=2025, title = “To year”, minval=2011)

//DEFINITIONS

shortMa = sma(close, 100)

longMa = sma(close, 200)

//LOGIC

timeInRange = (time > timestamp(fromYear, fromMonth, fromDay, 00, 00)) and (time < timestamp(toYear, toMonth, toDay, 23, 59))

longSignal = crossover(shortMa, longMa)

shortSignal = crossover(longMa, shortMa)

//POSITIONS

strategy.entry(id=“longPosition”, long=true, qty=0.1, when=longSignal and timeInRange)

strategy.entry(id=“shortPosition”, long=false, qty=0.1, when=shortSignal and timeInRange)

Tested in blocks of 3 months from the 1st Feb 2020 to 15th Feb 2021. The profit factor during the whole year its 2.3.

//@version=4
strategy(title = “Moving Average Crossing”, overlay=true, initial_capital=2000, commission_type=strategy.commission.percent, commission_value=0.2)

//DATE & TIME
fromMonth = input(defval=2, title = “From month”, minval=1)
fromDay = input(defval=1, title = “From day”, minval=1)
fromYear = input(defval=2020, title = “From year”, minval=2014)

toMonth = input(defval=5, title = “To month”, minval=1)
toDay = input(defval=15, title = “To day”, minval=1)
toYear = input(defval=2020, title = “To year”, minval=2015)

//DEFINITIONS
shortMA = sma(close,12)
longMA = sma(close,30)
r = rsi(close,12)

//LOGIC
timeInRange = (time > timestamp(fromYear, fromMonth, fromDay, 00, 00)) and (time < timestamp(toYear, toMonth, toDay, 23, 59))
longSignal = crossover(shortMA, longMA) and timeInRange and r < 50 and volume > 300
shortSignal = crossover (longMA, shortMA) and timeInRange and r > 50 and volume > 300

//POSITIONS
strategy.entry(id=“longPosition”, long=true, qty=0.1, when = longSignal)
strategy.entry(id=“shortPosition”, long=false, qty=0.1, when = shortSignal)

1 Like

Below my strategy. I did attempt to go vor the change in direction for the MA and also consider price oscilation.
I did find to select the candle time has also a large influence on the result of the stragegy. Whilst it works on a certain chart time it miserabely fails on an other.
I was able to get a profit factor of 1.78 on two consecutive backtest blocks of three month. Also risk management would help this strategy as some trades could be closed earlier to prevent exessive losses. Not happy yet with this but a basis to imporve up one.
Side not: I had gotten once a prime example for curve fitting. Provit factor just short of 4 but fails at any other dataset.
Not happy with the strategy yet.

strategy(title = "MA PPO with Bottom Top", overlay=true, initial_capital=2000, commission_type=strategy.commission.percent, commission_value=0.2 )

//DATE AND TIME
fromYear = input(defval=2020, title="From Year", minval=2015)
fromMonth = input(defval=1, title="From Month", minval=1)
fromDay = input(defval=4, title="From Day", minval=1)

toYear = input(defval=2020, title="To Year", minval=2015)
toMonth = input(defval=4, title="To Month", minval=1)
toDay = input(defval=4, title="To Day", minval=1)

malength=input(9, "Length MA", minval=1)
masource=input(close, title="Source MA")
expma=input(false, "exponential MA")
shortlen=input(14, "Short Length PPO", minval=1)
longlen=input(28, "Long Length PPO", minval=1)
backstepBT = input(3, "Back Step Gradient", minval=1)
src = input(close, title="Source PPO")
exp = input(false, "exponential PPO")
dirlength=input(3, "Directional length PPO", minval=1)

//DEFINITIONS
exsima(source, length)=>
    exma = ema(source, length)
    sima = sma(source, length)
    expma ? sima : exma
ma = exsima(masource, malength)
esma(source, length)=>
	s = sma(source, length)
	e = ema(source, length)
	exp ? e : s
short = esma(src, shortlen)
long = esma(src, longlen)
po = (short - long)/long*100
bt = (po[0]-po[backstepBT])/(backstepBT-0)*2
gradma = (ma[0]-ma[backstepBT])/(backstepBT-0)/(100/malength)

//LOGIC
timeInRange = (time > timestamp(fromYear, fromMonth, fromDay, 00, 00)) and (time < timestamp(toYear, toMonth, toDay, 23, 59))
longSignal =   gradma[2]<0 and gradma[1]>=0 and gradma[0]>0 and rising(po, dirlength) and timeInRange
shortSignal = gradma[2]>0 and gradma[1]<=0 and gradma[0]<0 and falling(po, dirlength) and timeInRange


//POSITIONS
strategy.entry(id="longPosition", long=true, qty=0.1, when=longSignal)
strategy.entry(id="shortPosition", long=false, qty=0.1, when=shortSignal)

1 Like