Reading Assignment: Strategy Improvements

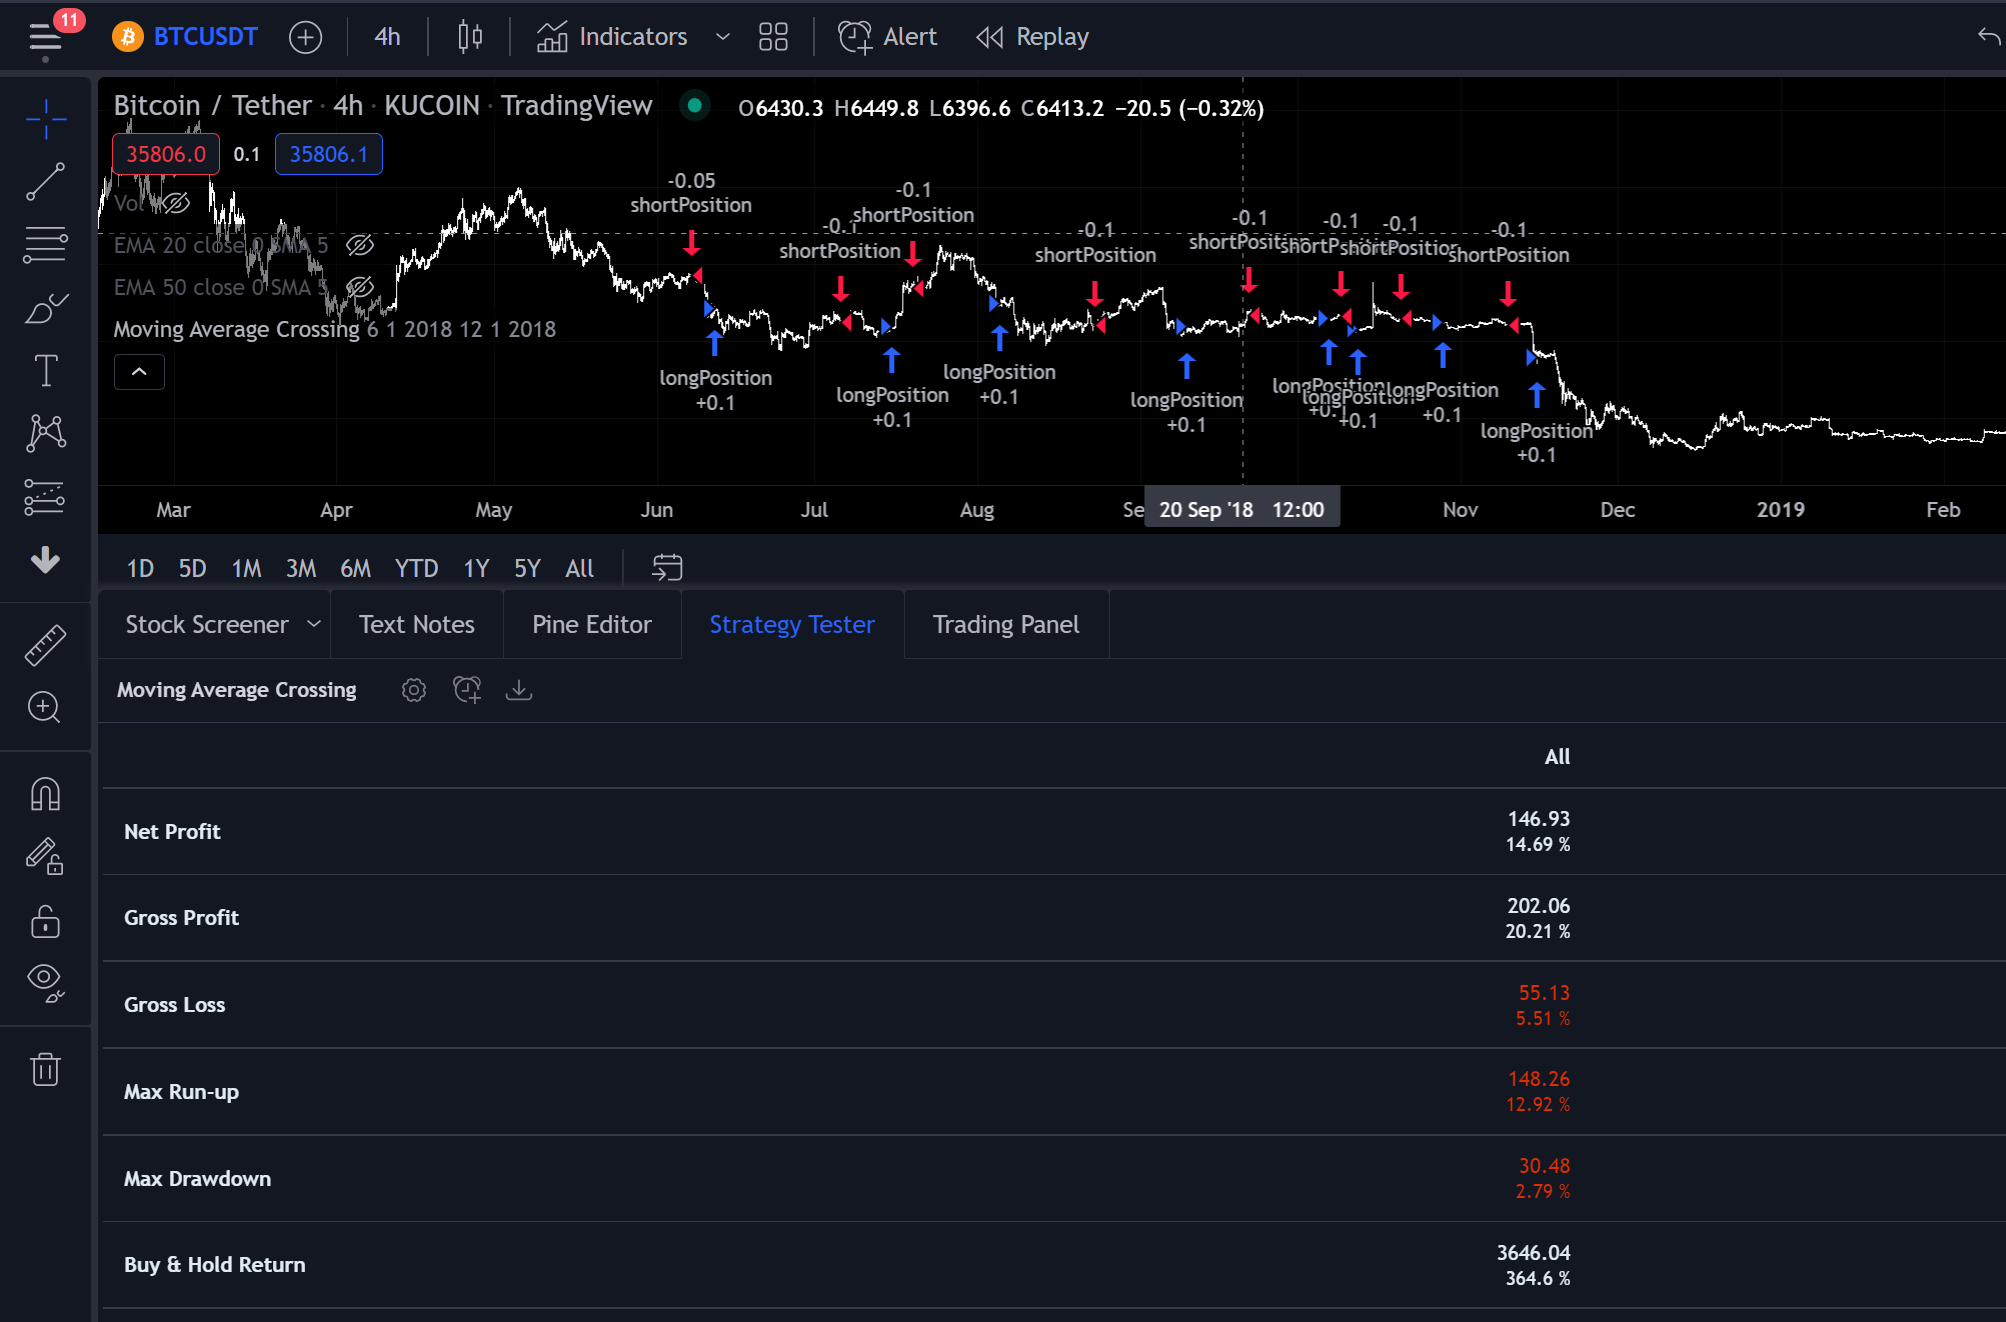
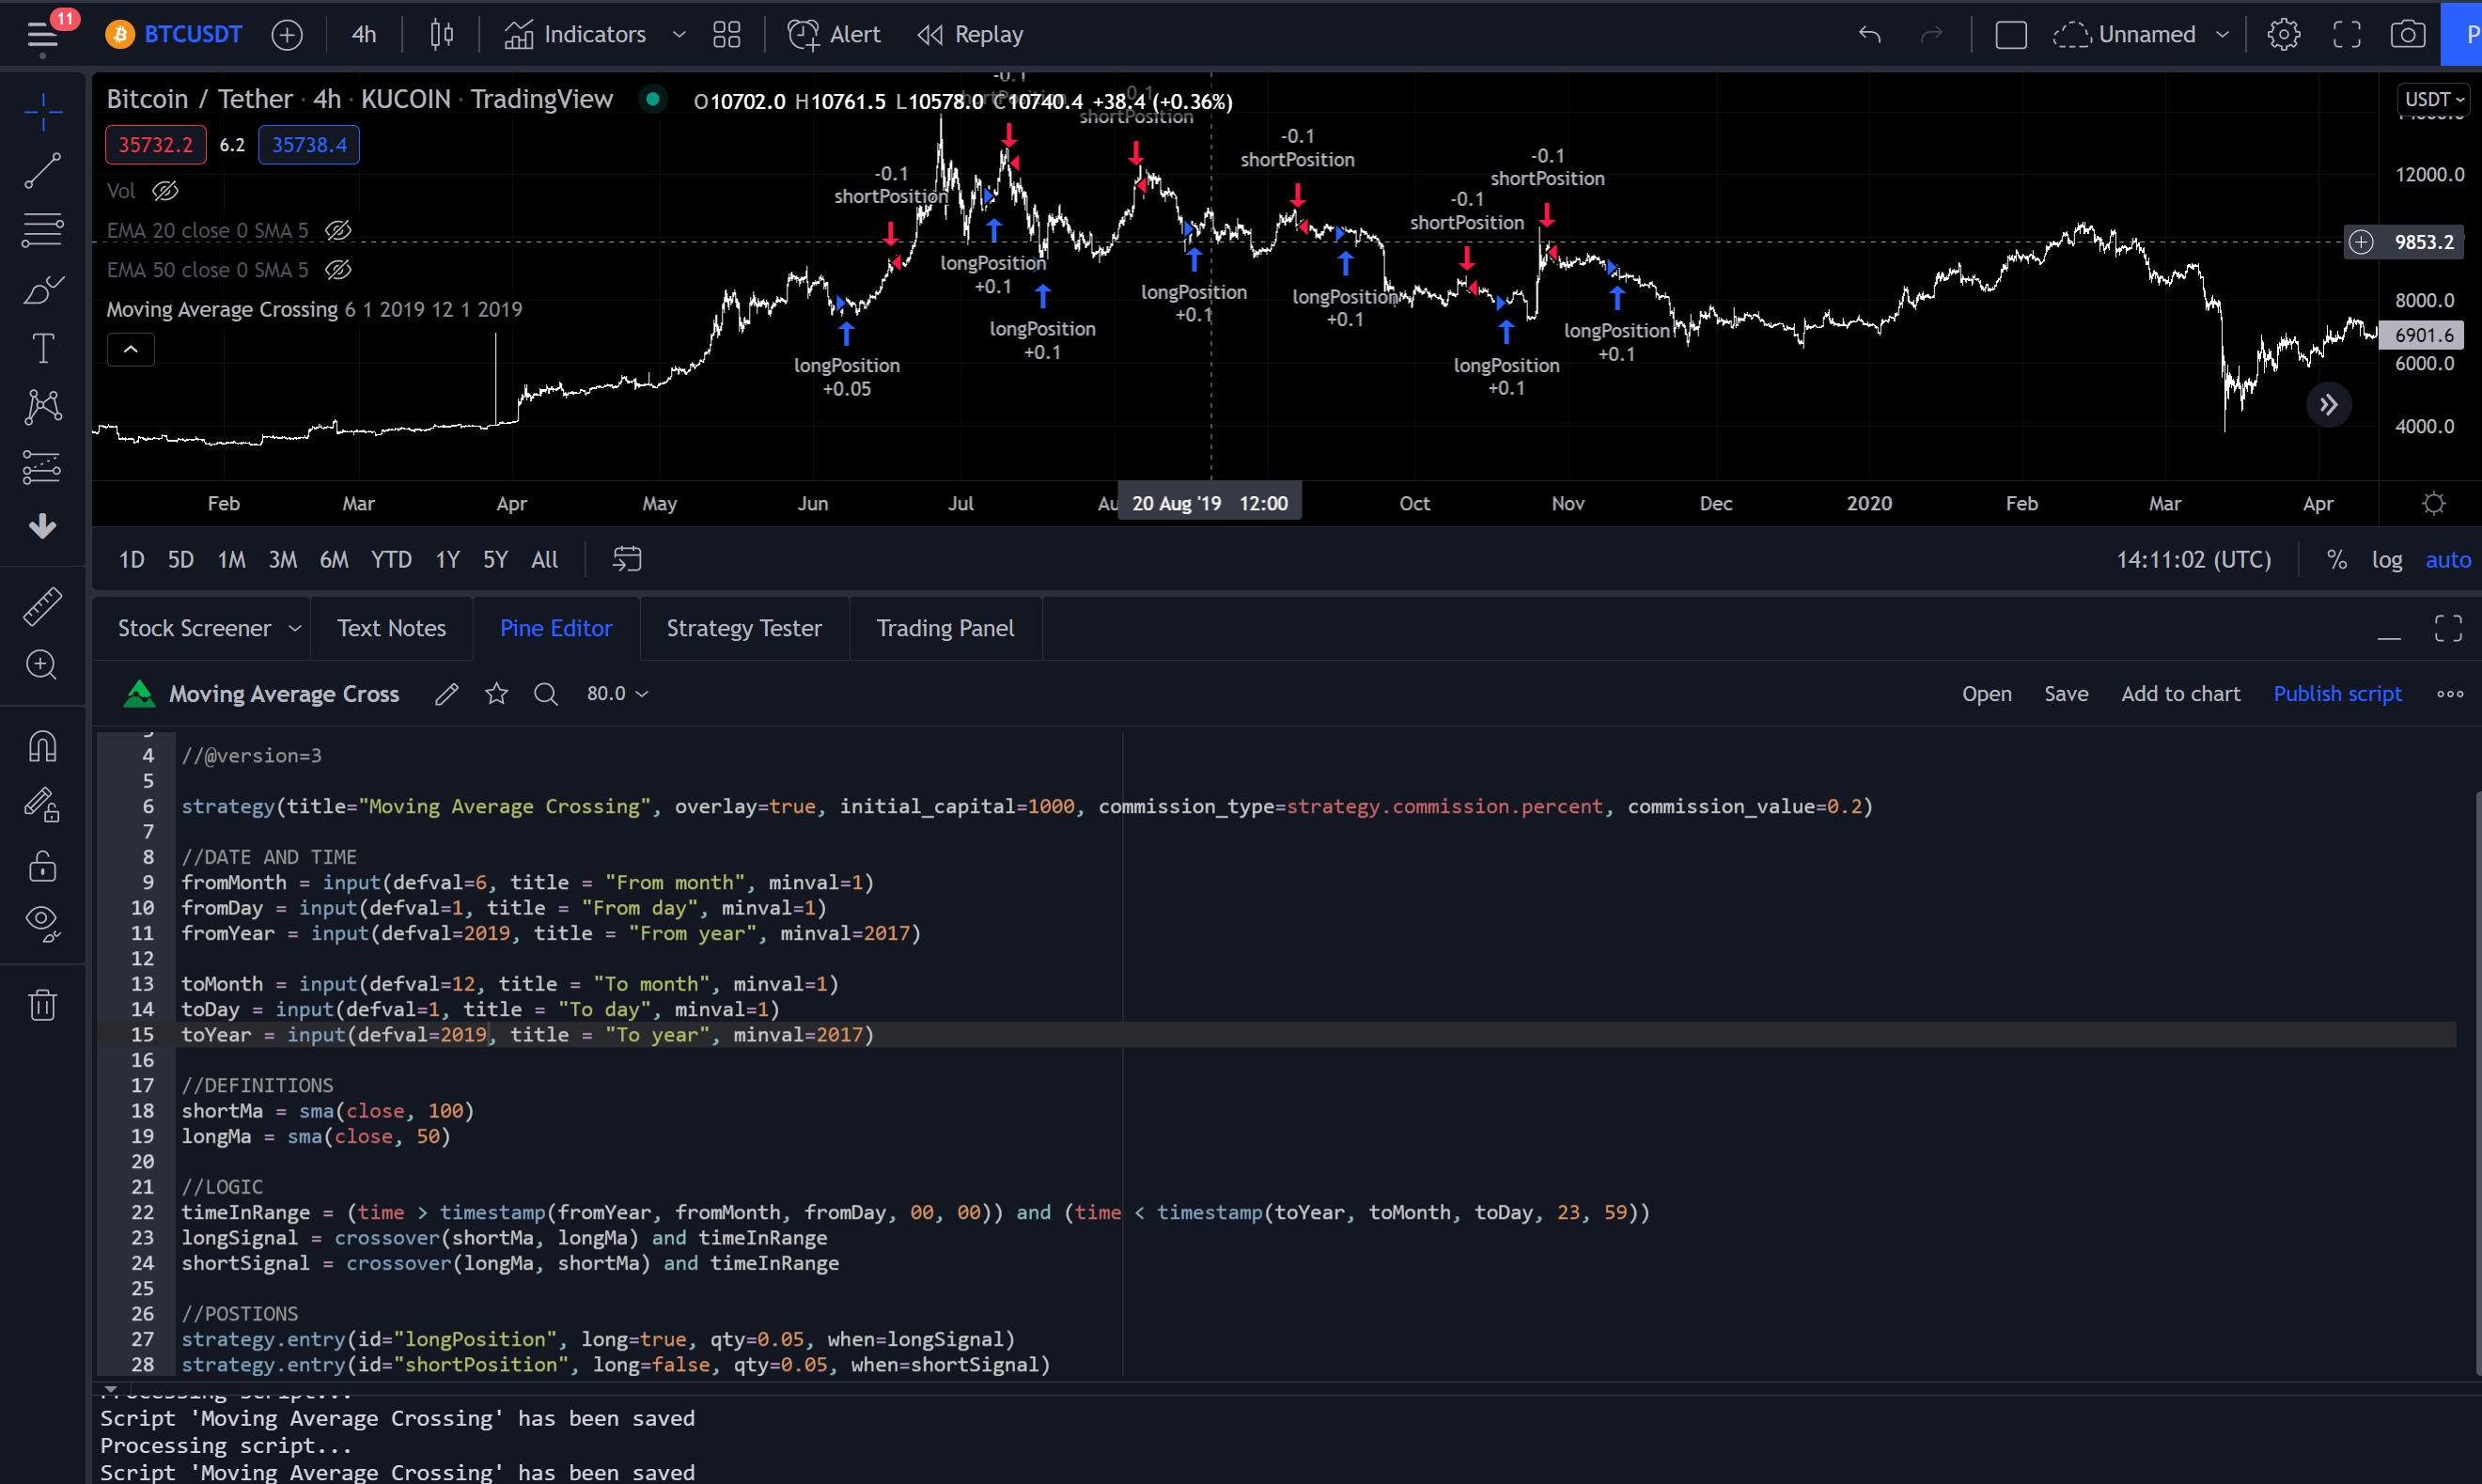
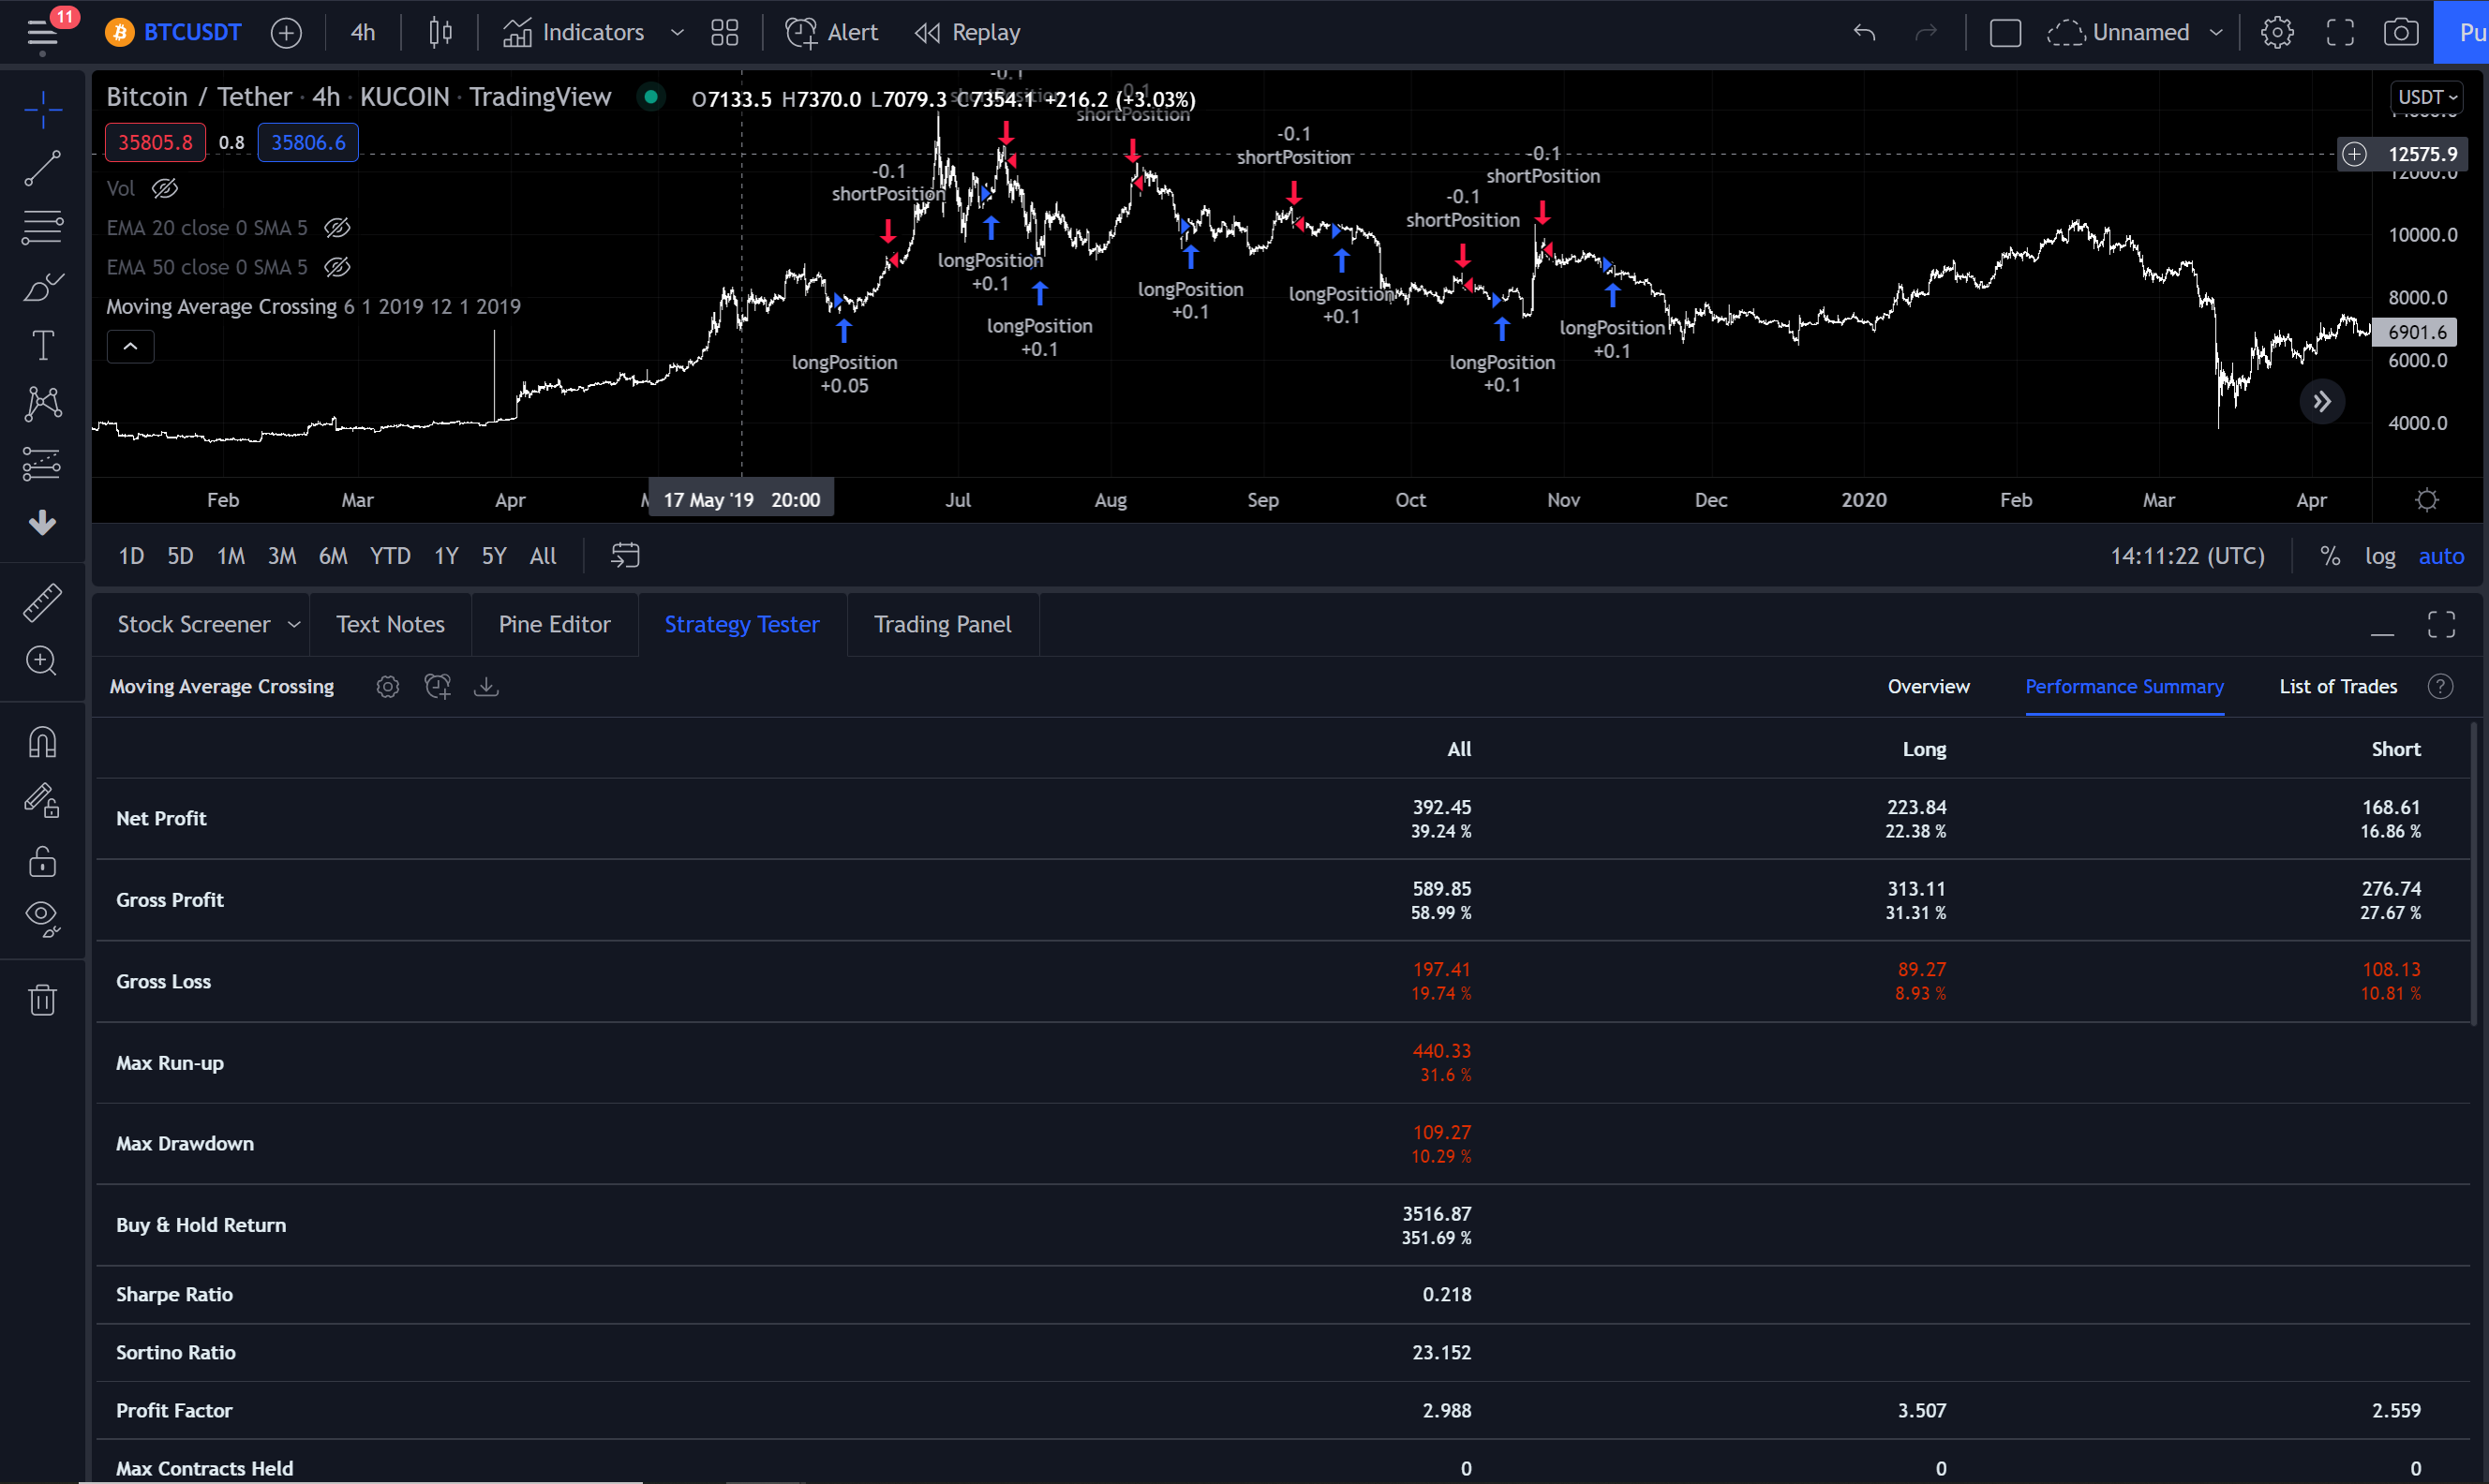
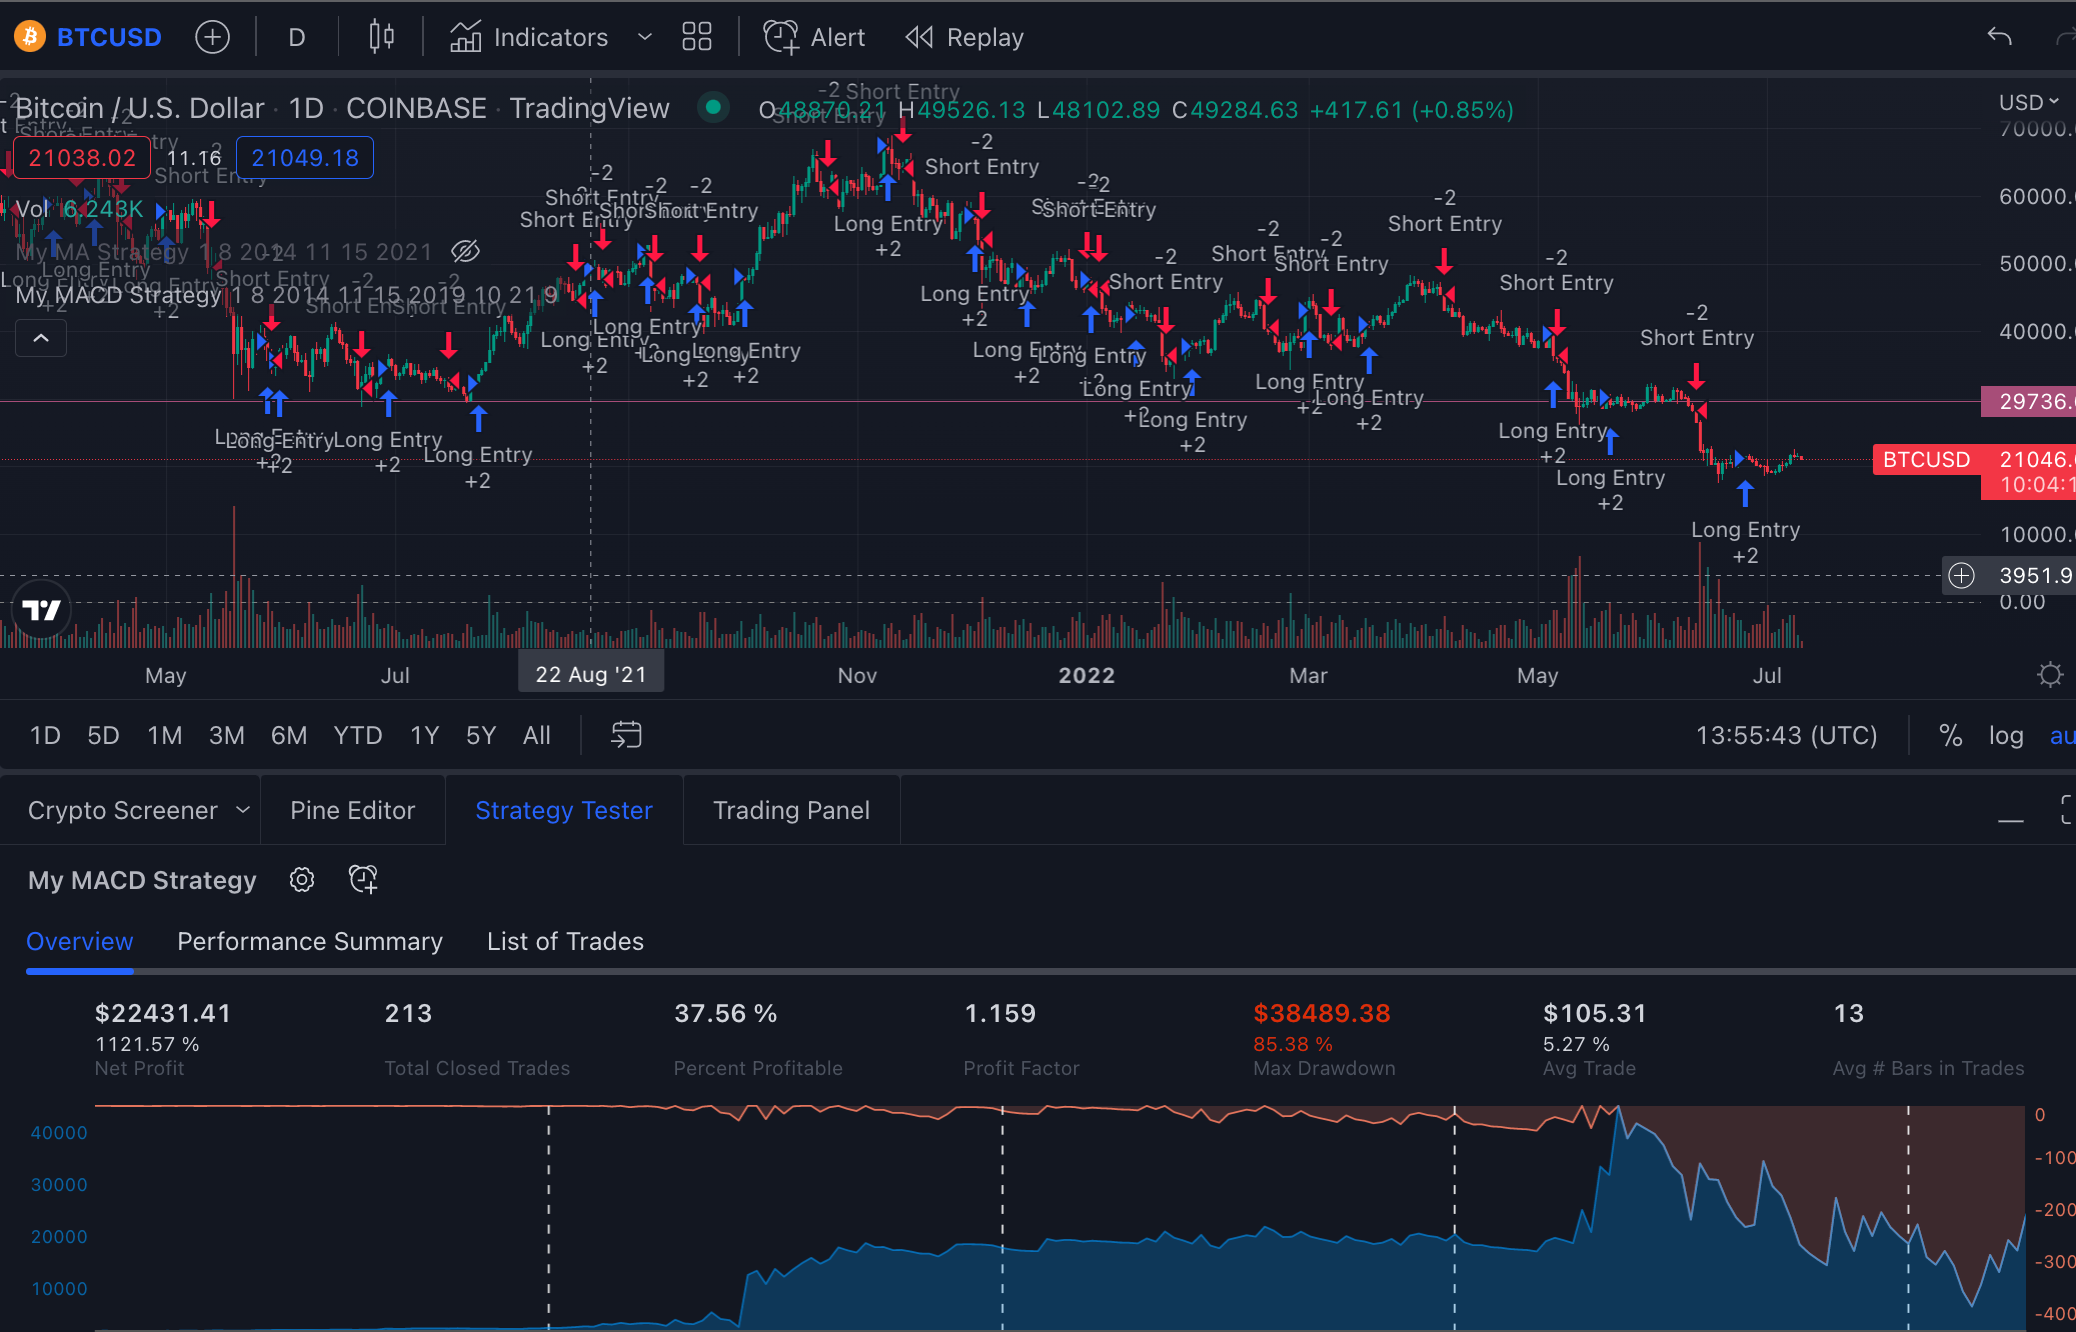
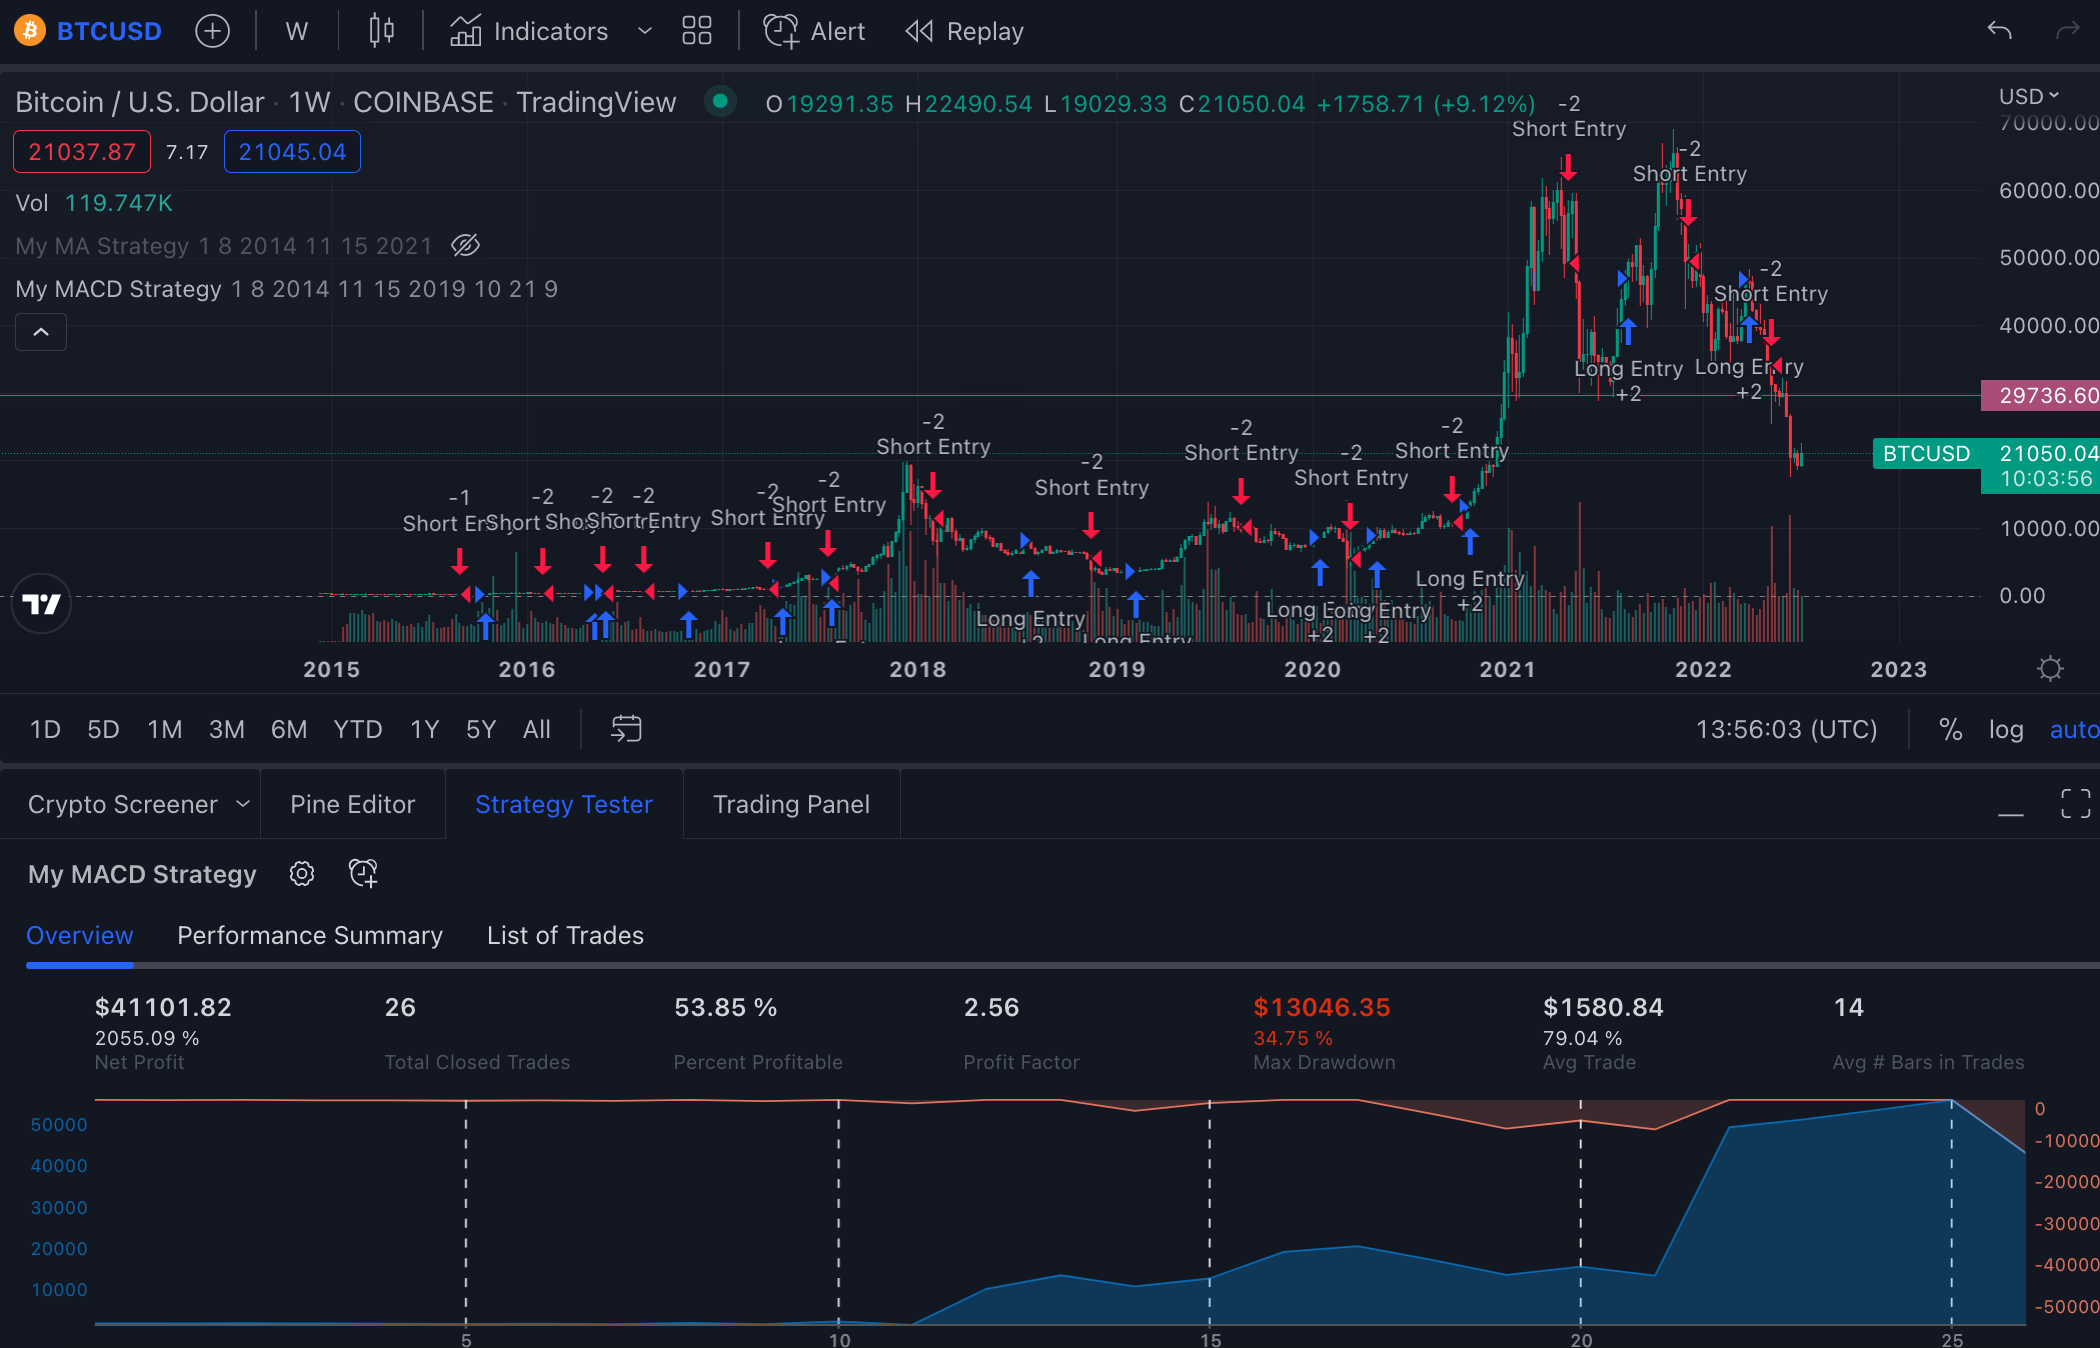
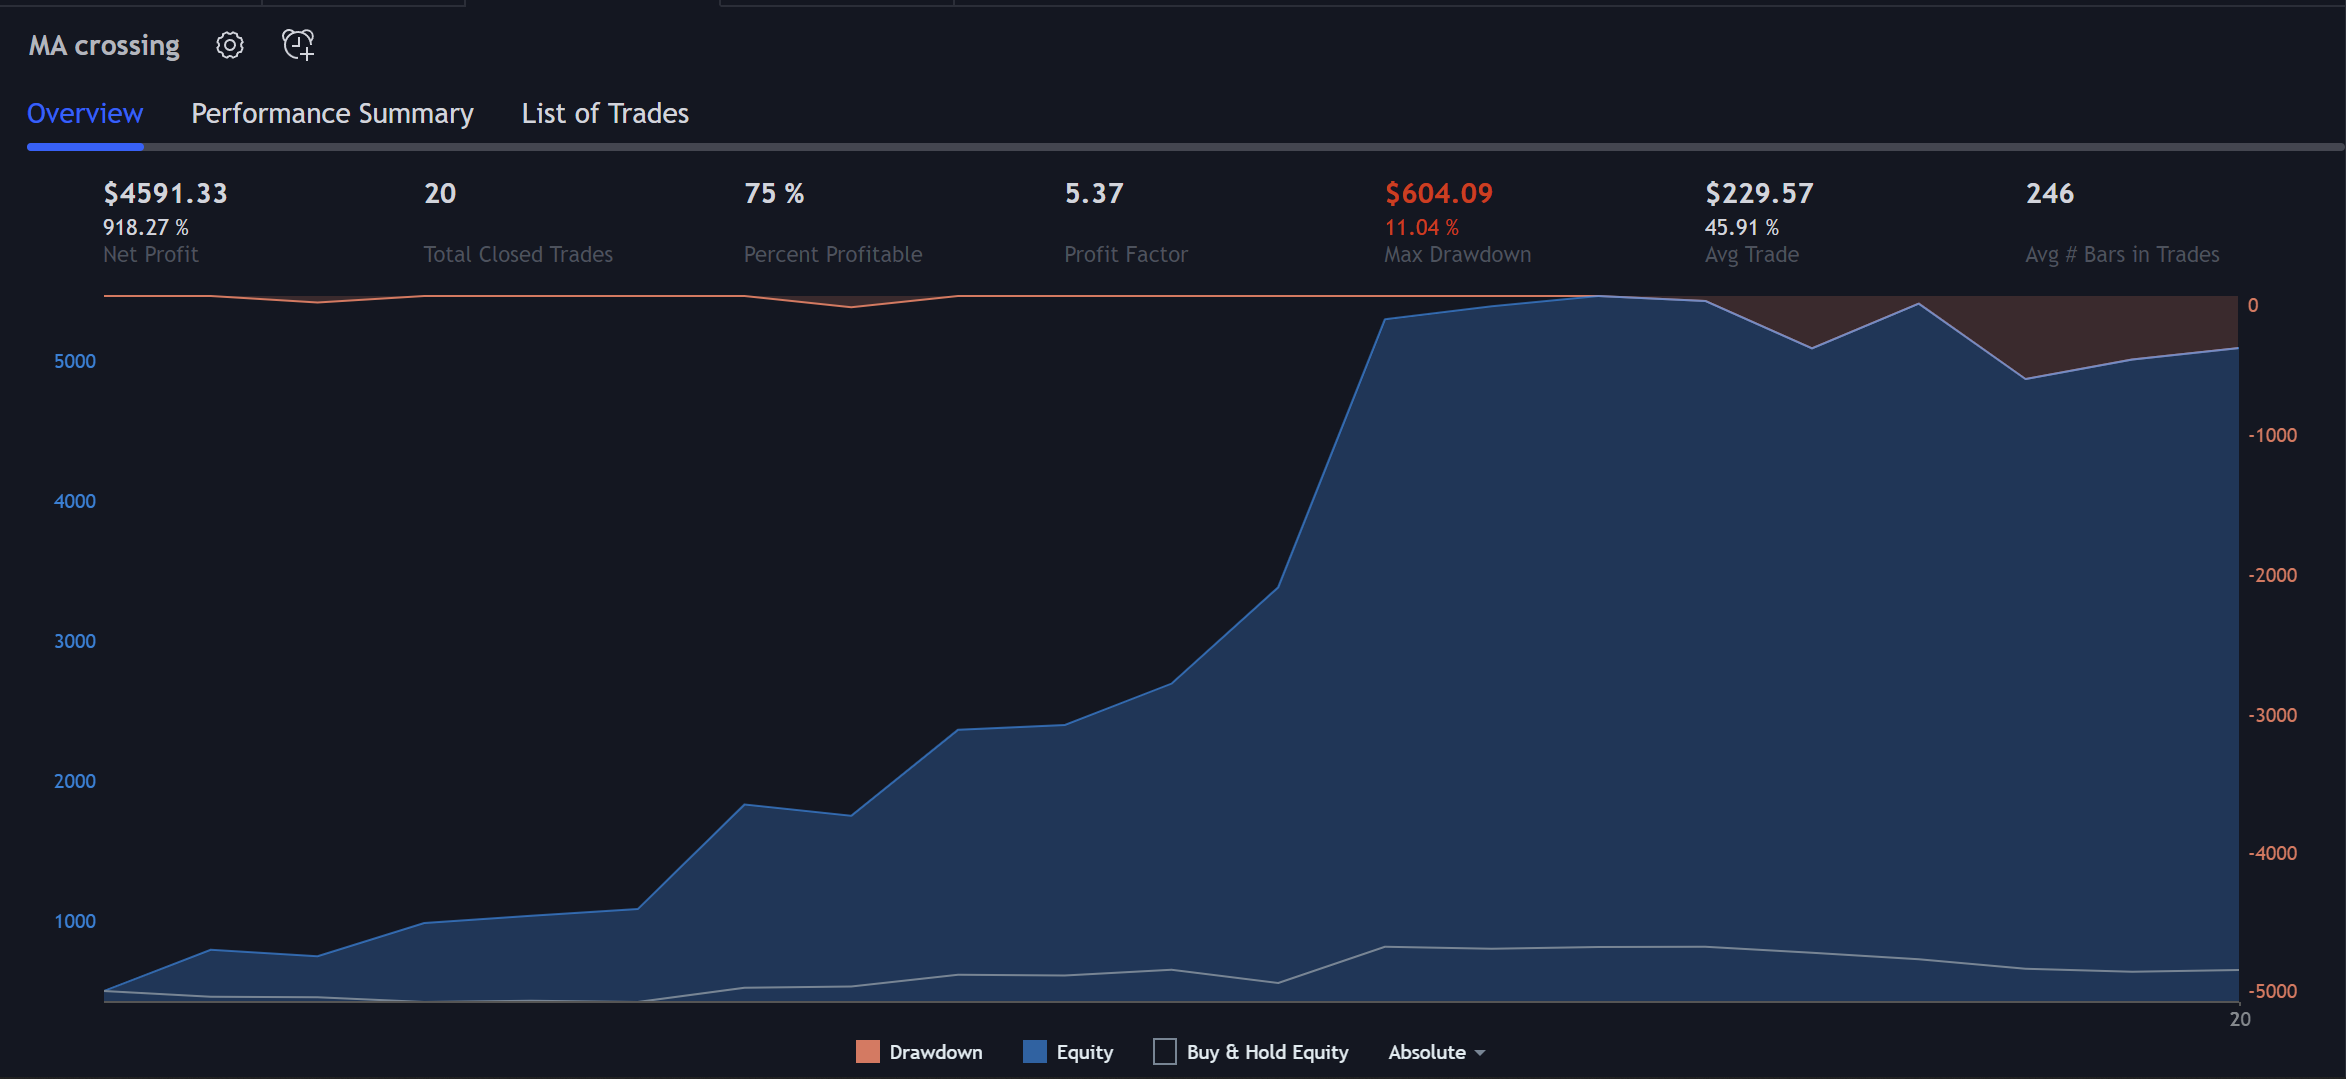
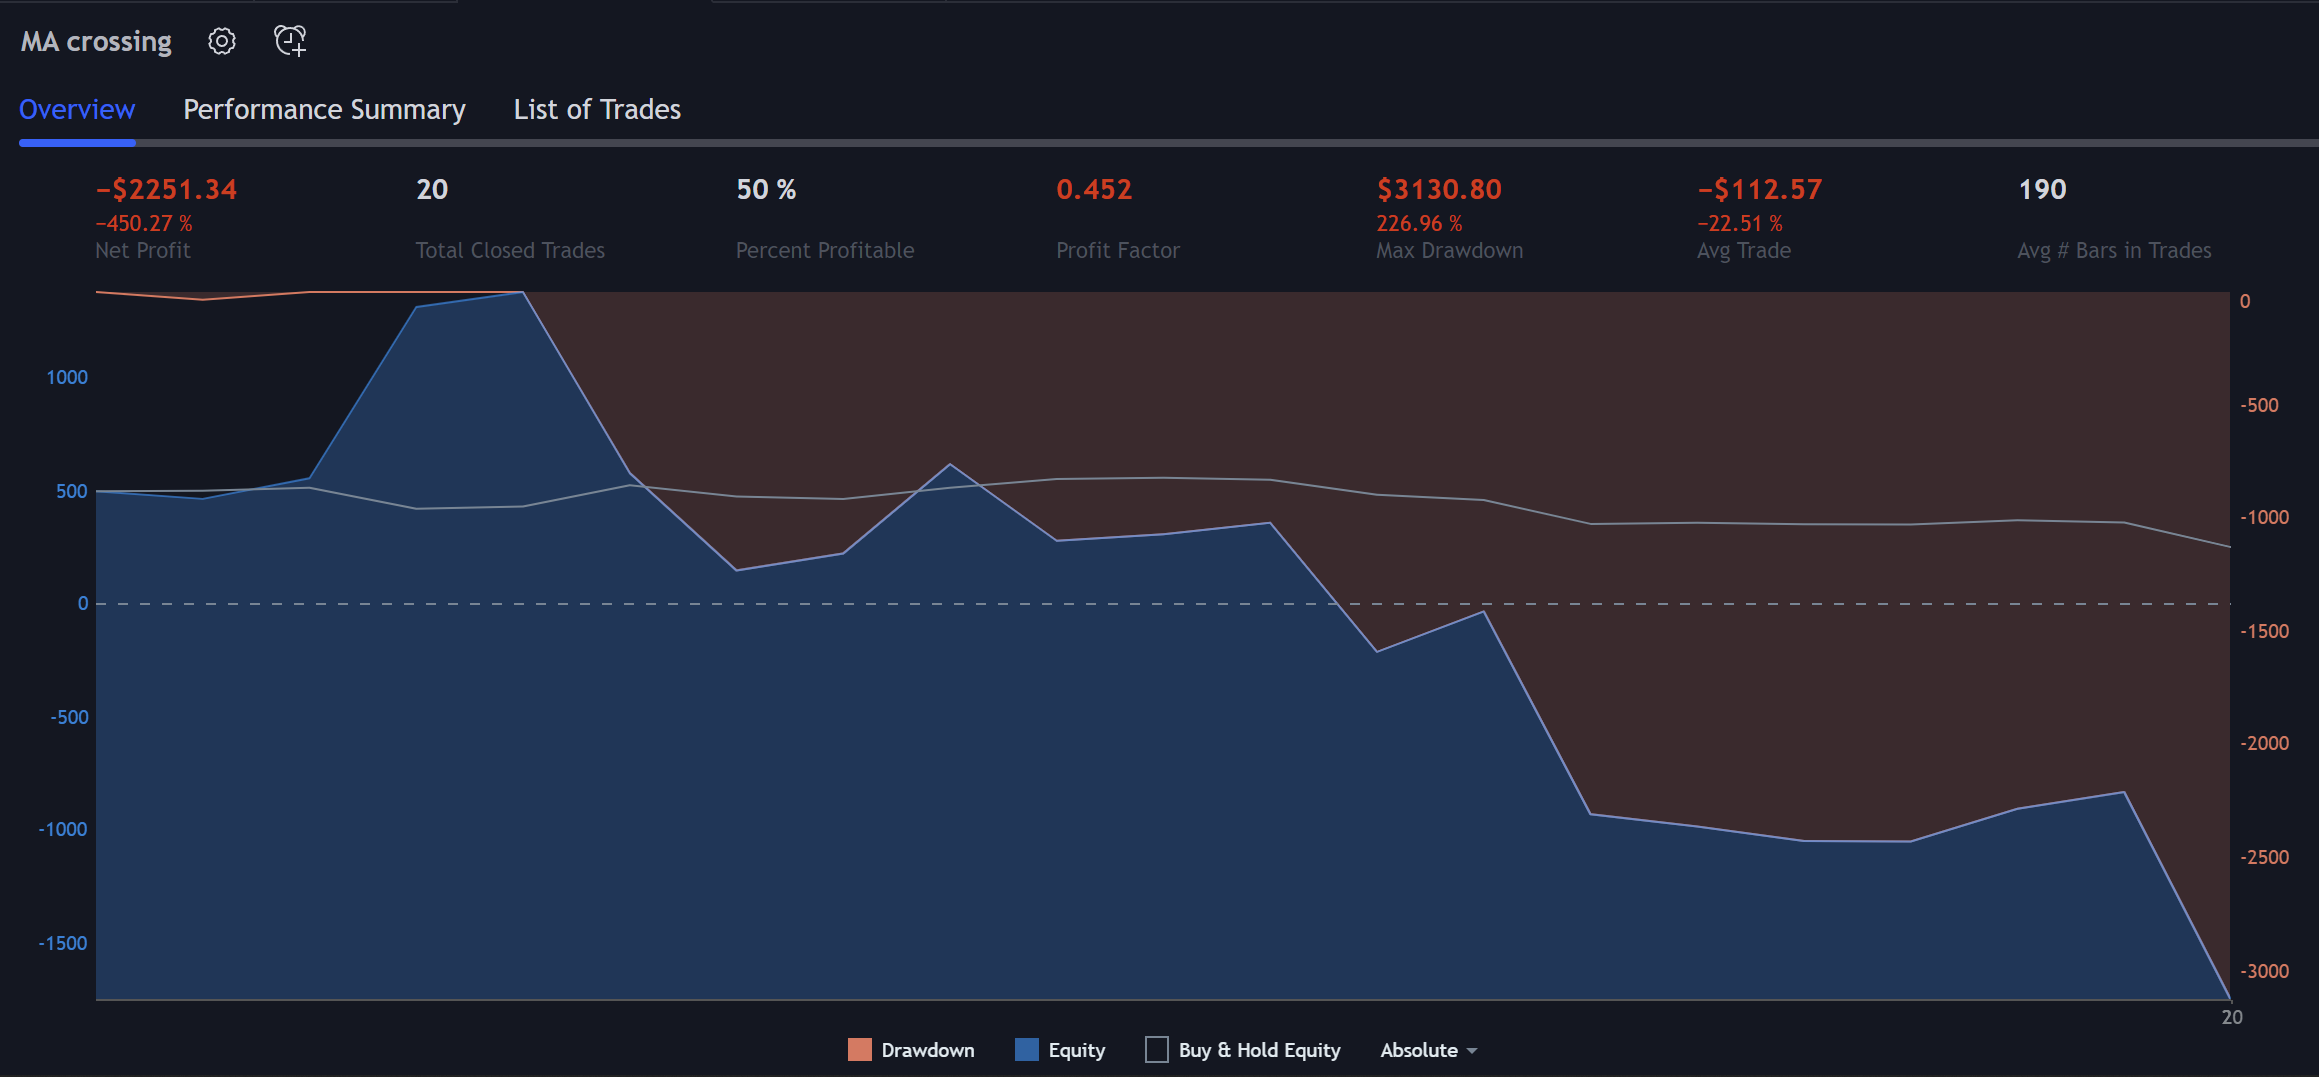
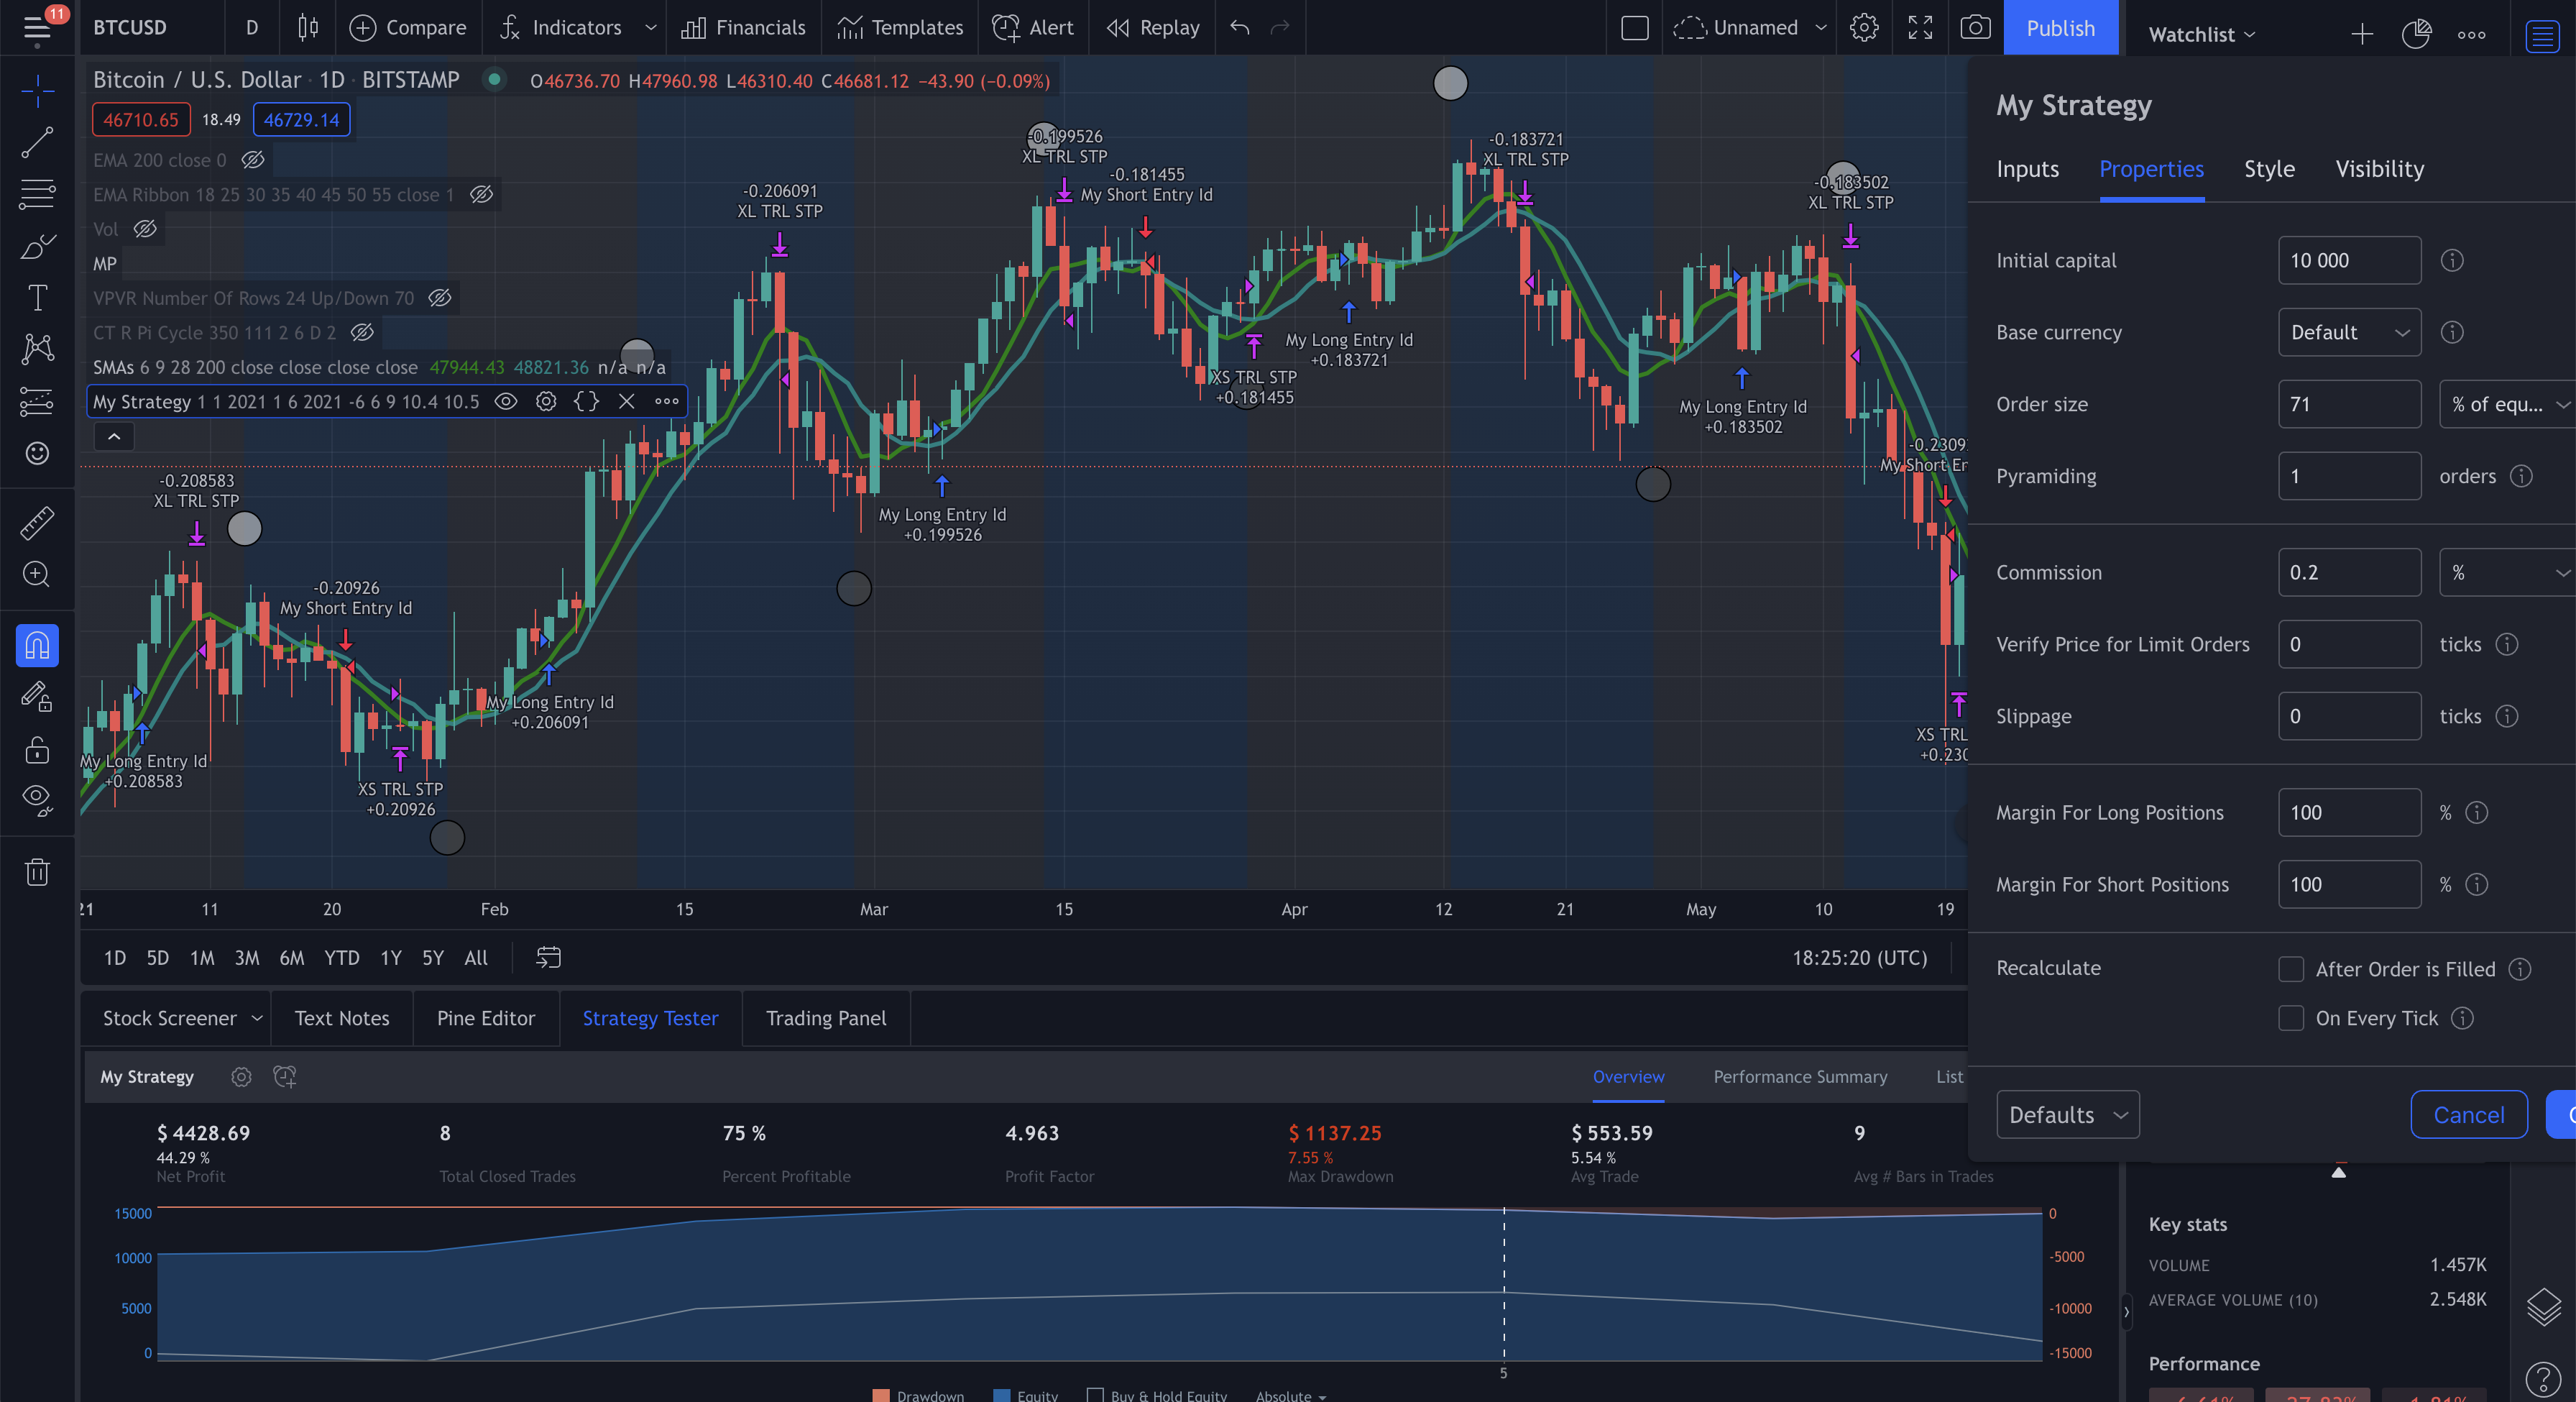
Here I have combined a script to trade the moon phases (that I found - credit to Pascal Simon) with a moving average cross strategy.
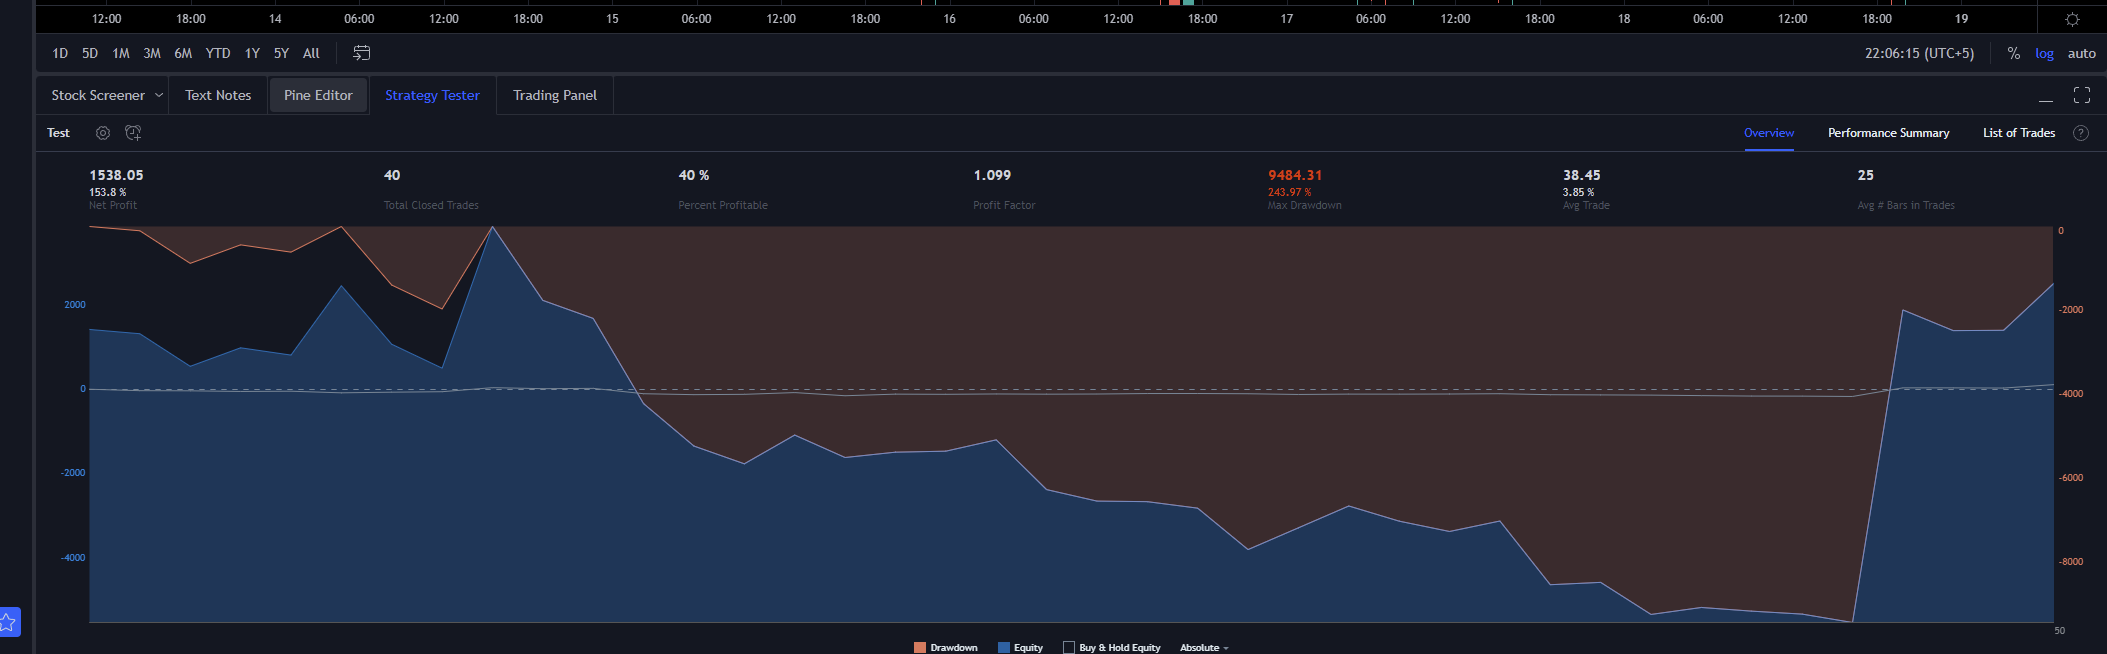
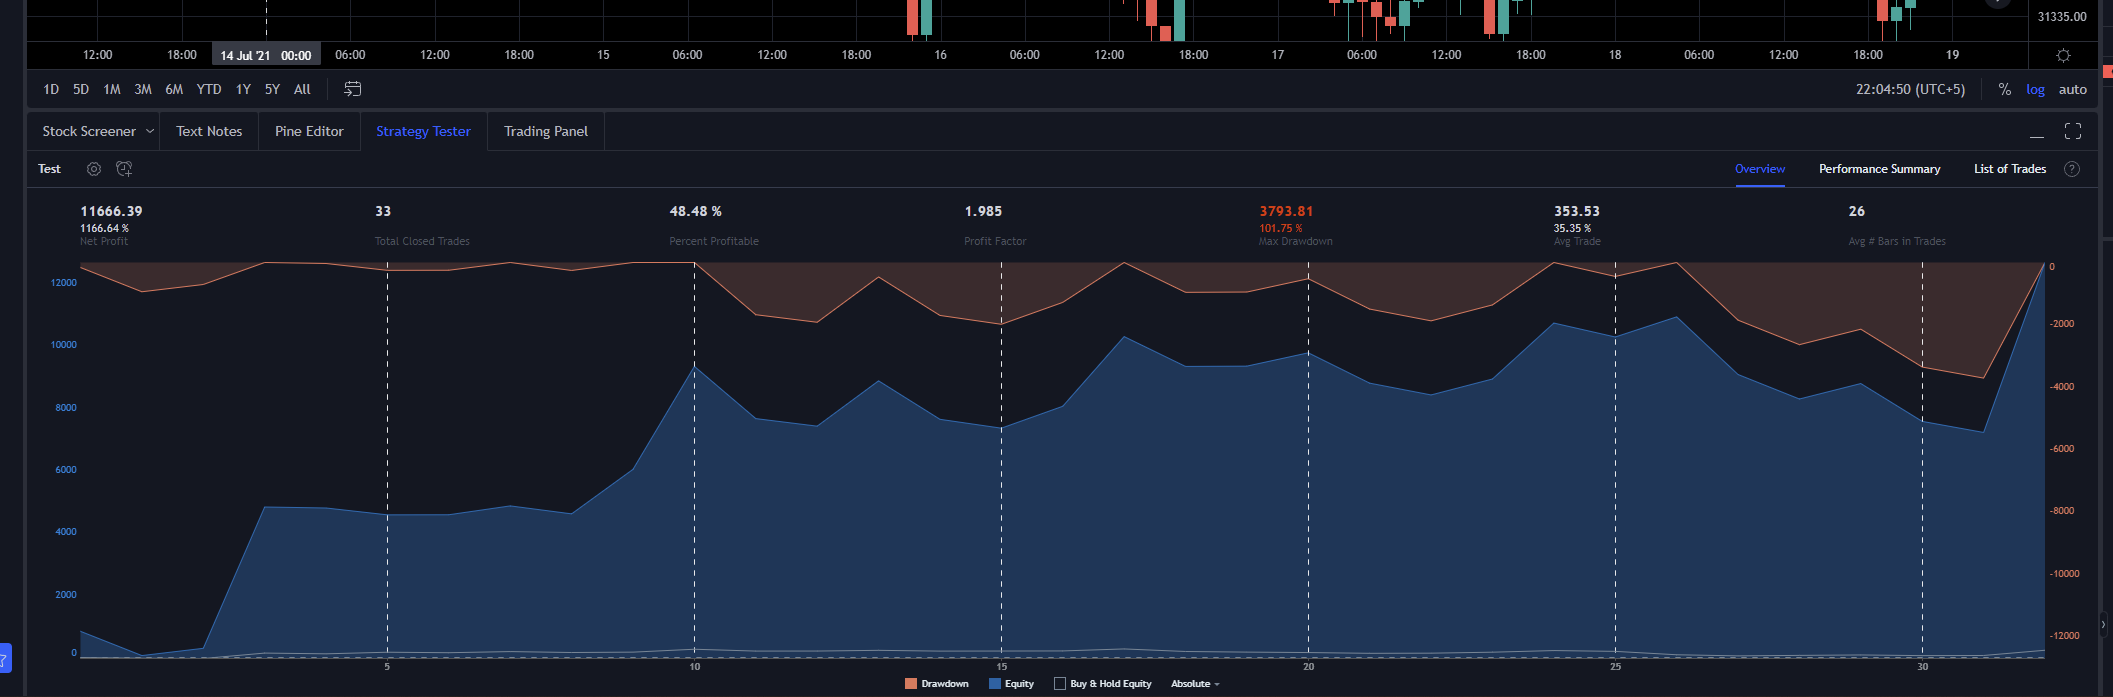
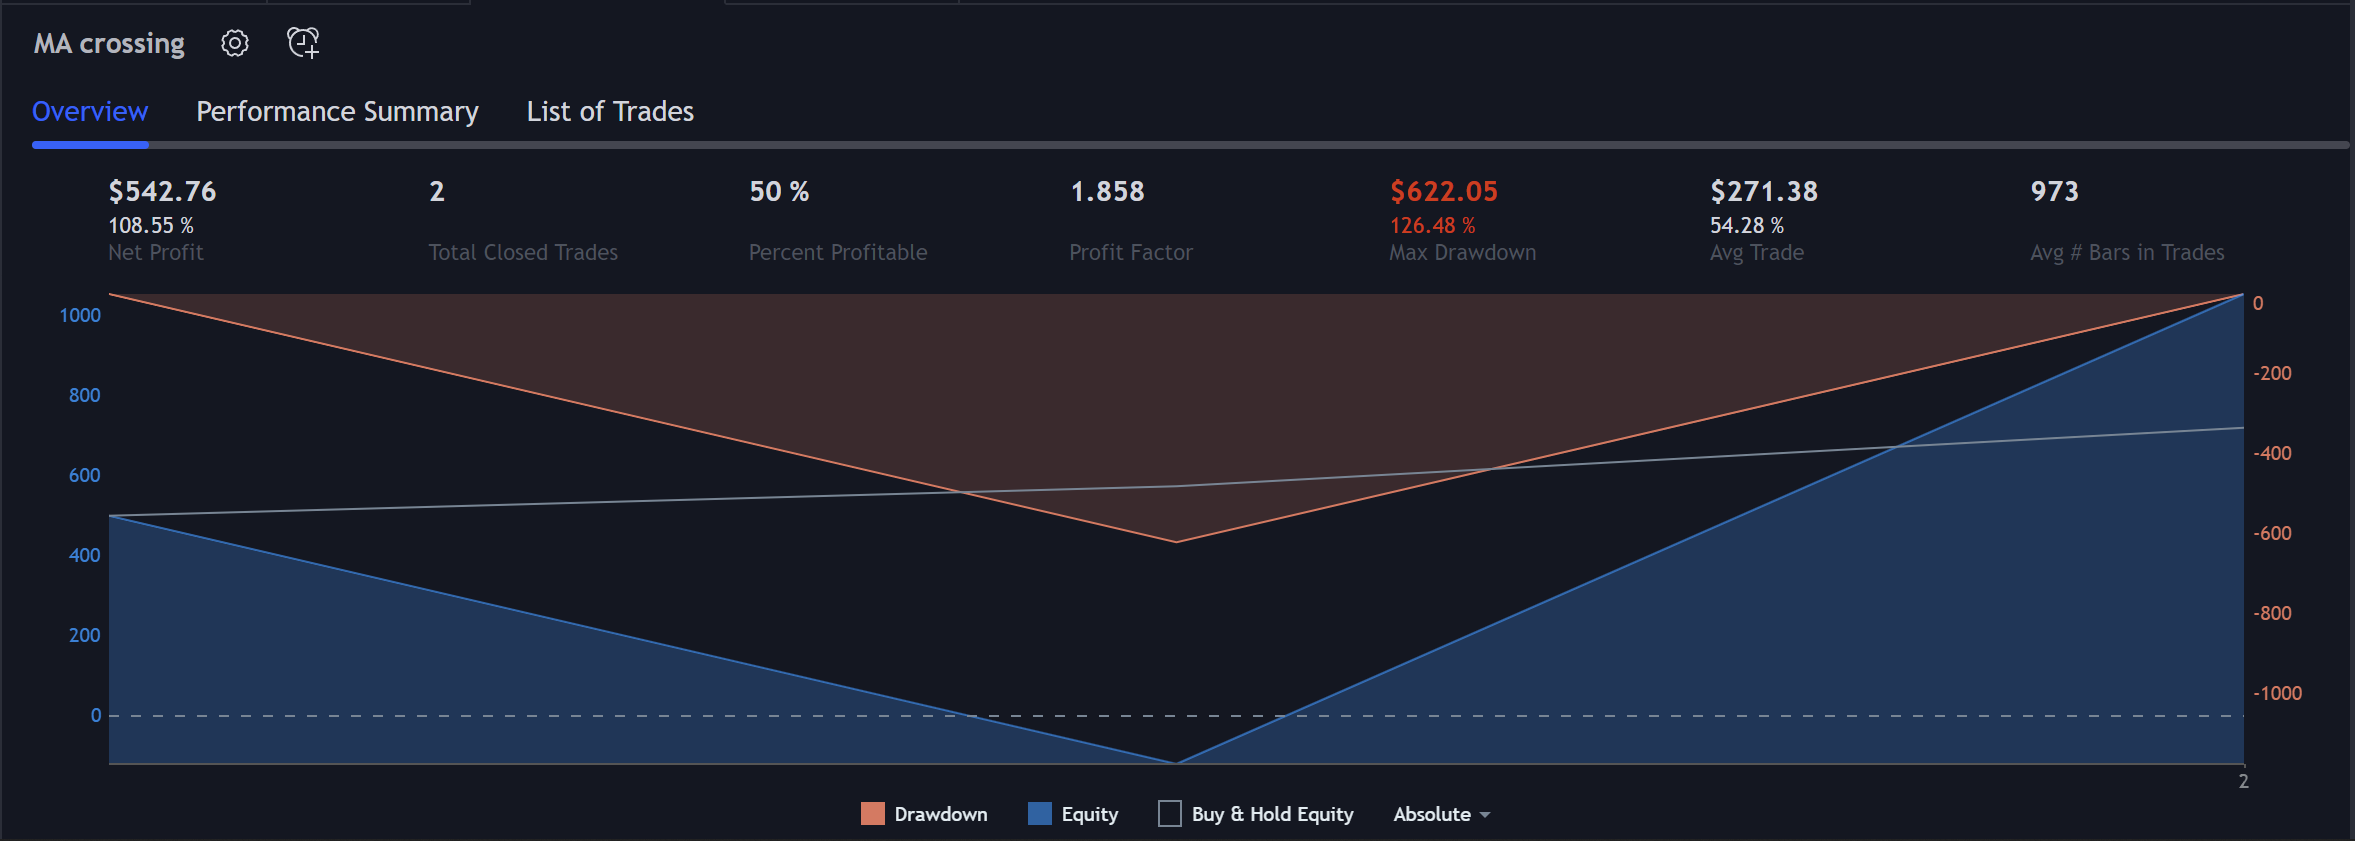
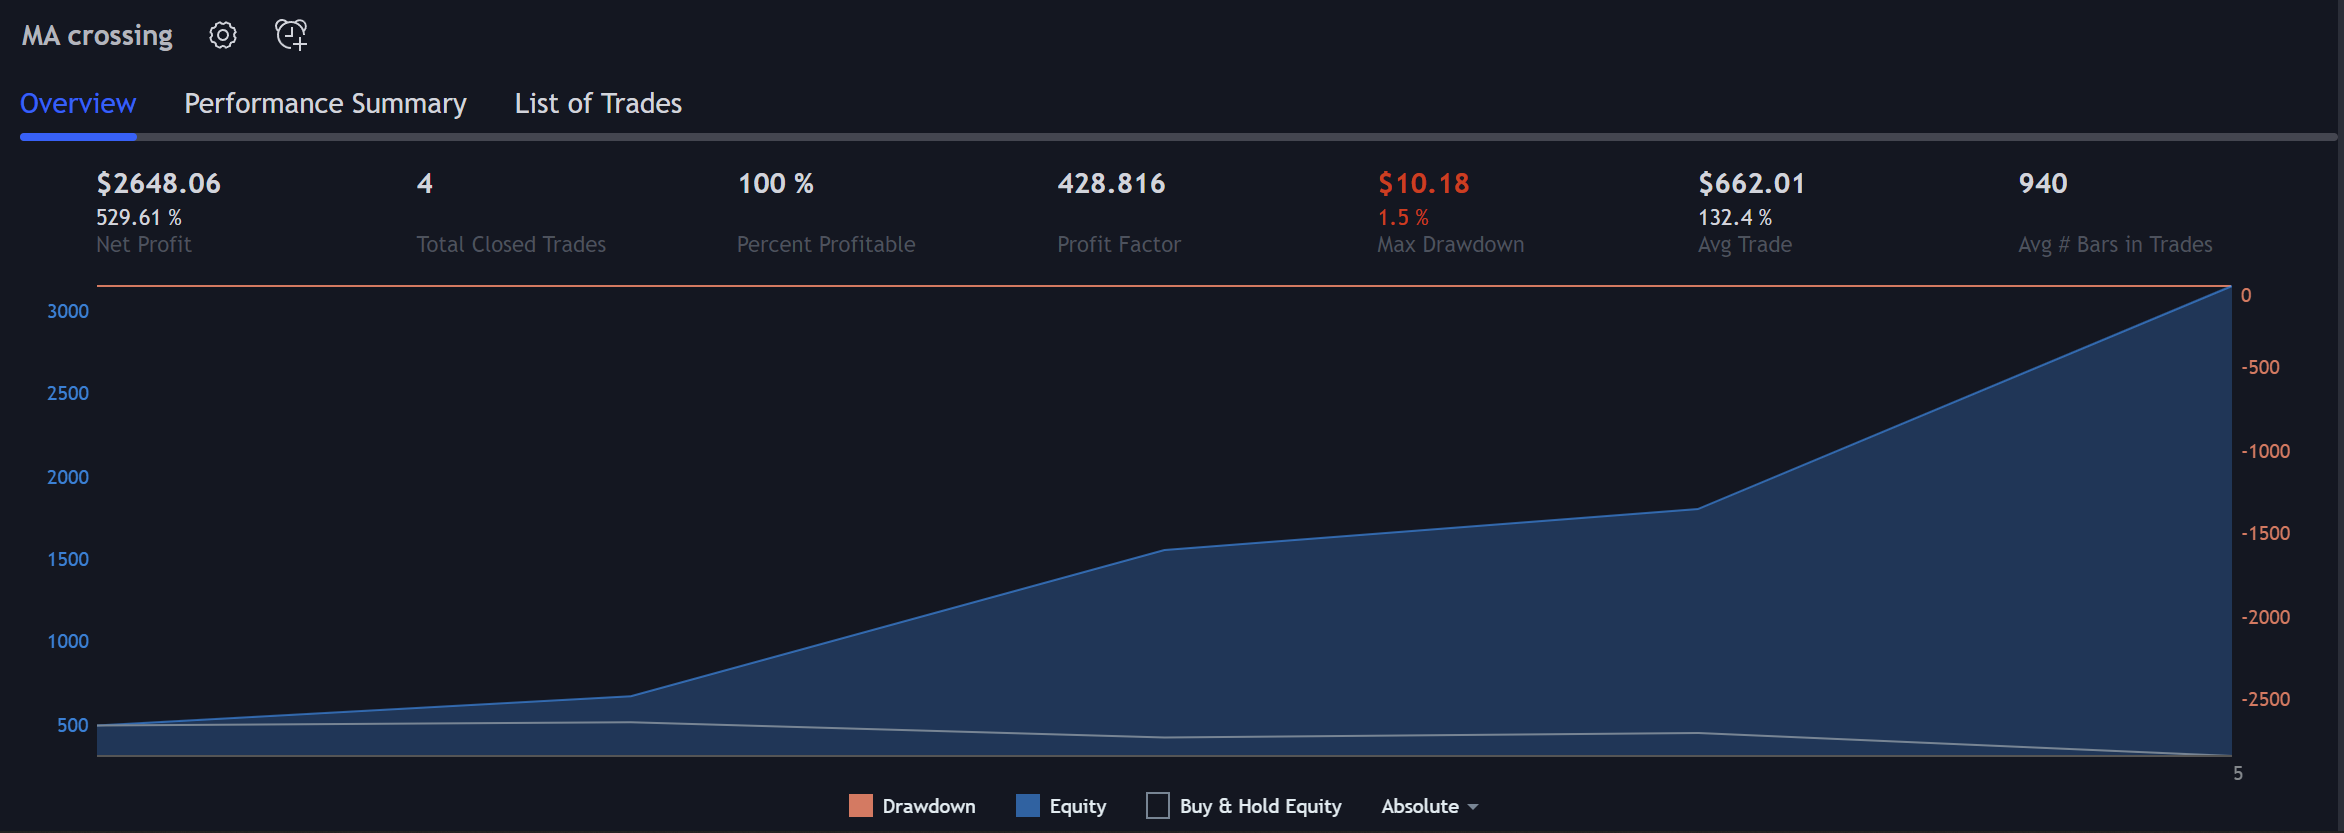
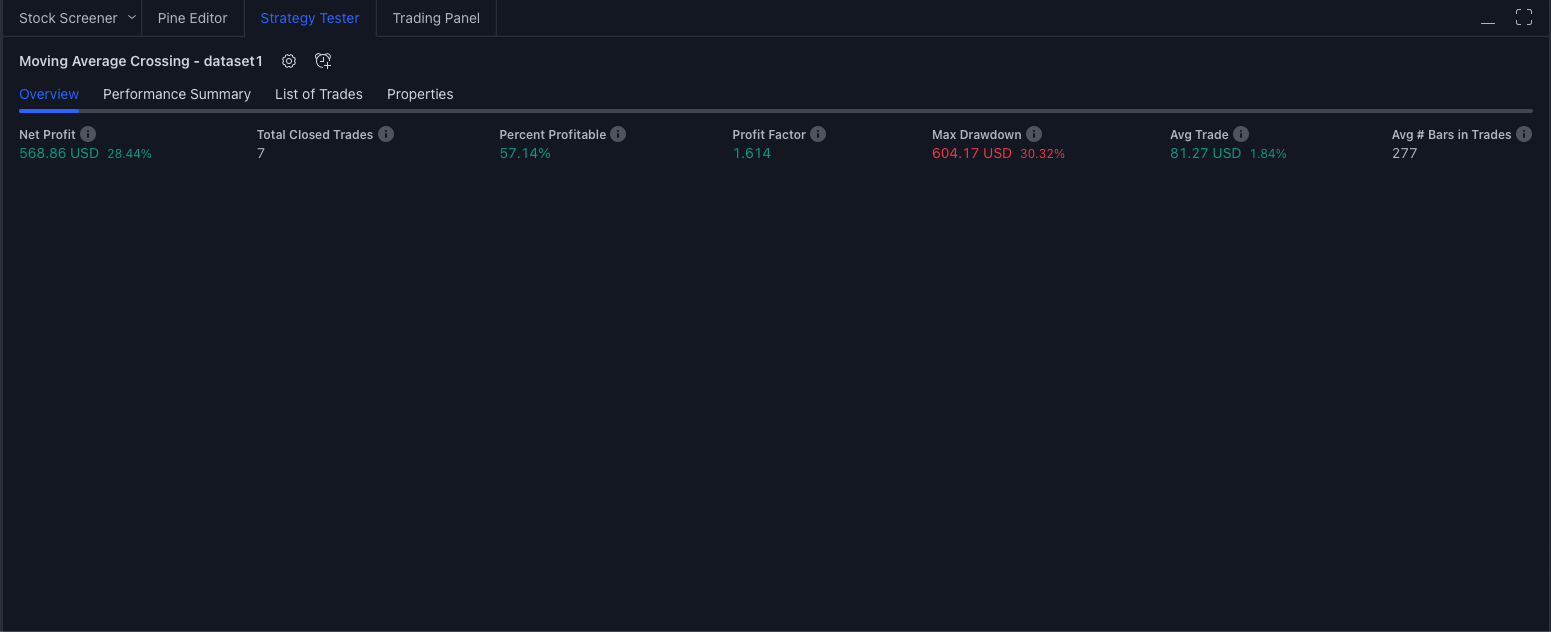
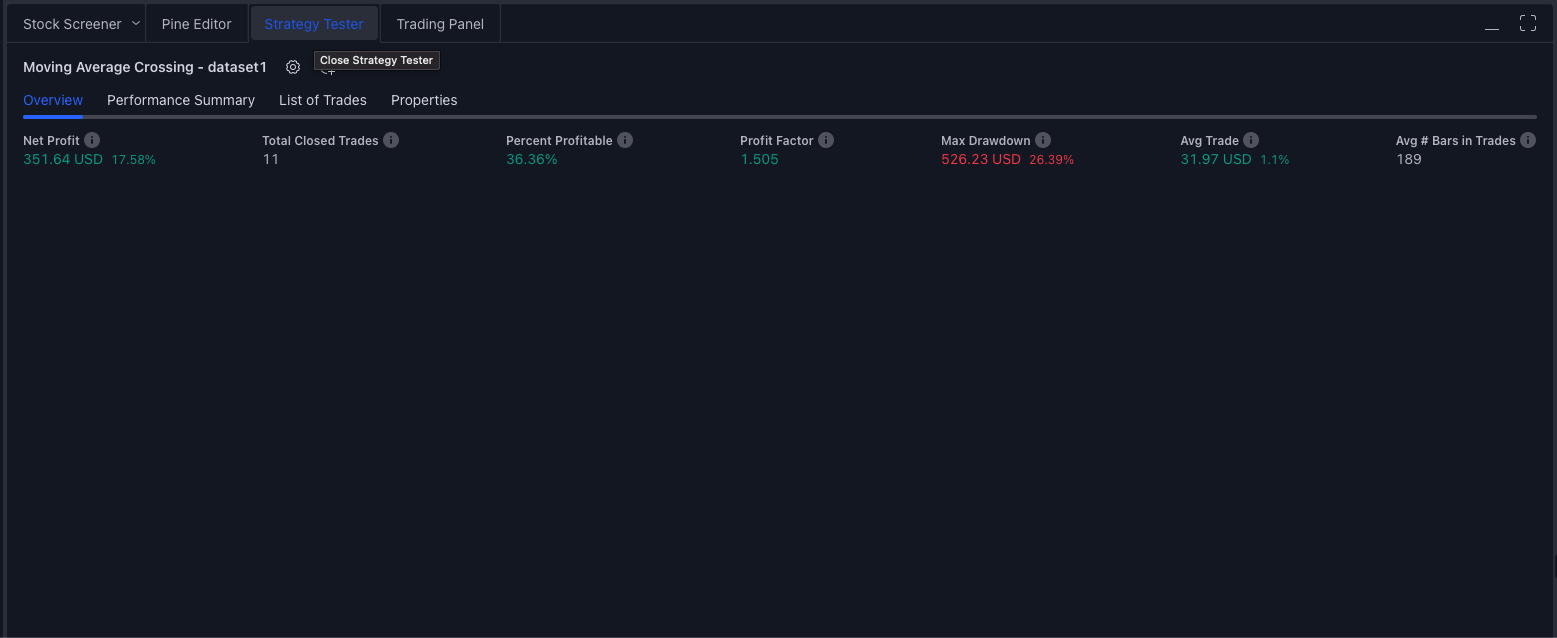
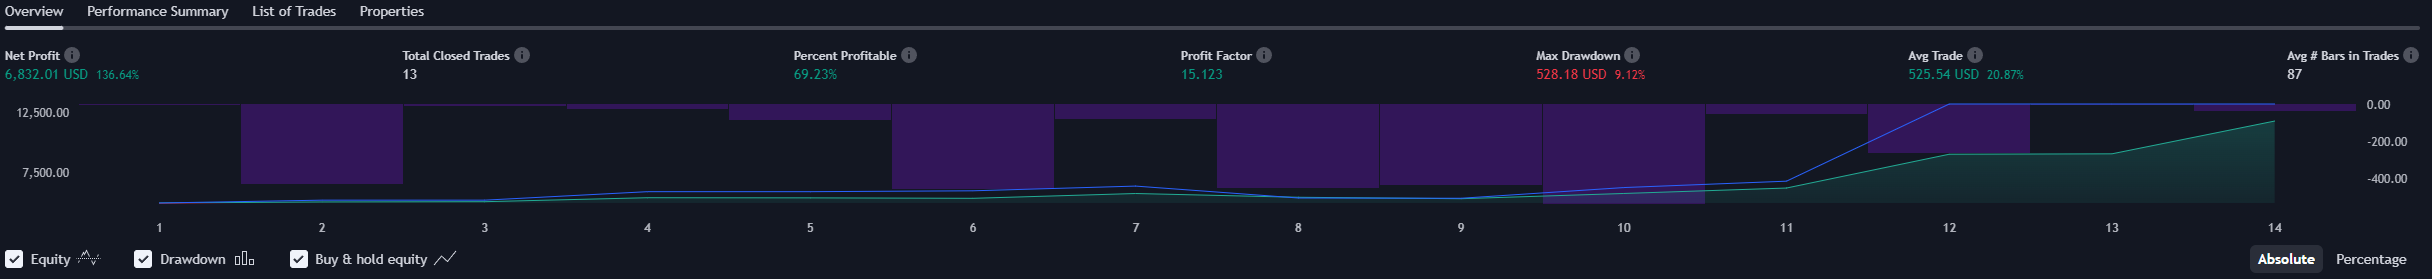
I have set the commission to 0.2% and get a fairly good profit factor (up to 7 on some 6 month periods) on different sets of data. An order size of about 70% and trailing stop losses for both long and short trades of about 10.5% seems to be the optimum.

I also used a variable offset to the moon phase days, offsetting this by about 6 days seems to give better results.

The moving averages I chose were 6 and 9 simple daily

The downside is that there are only a couple of trades a month max.

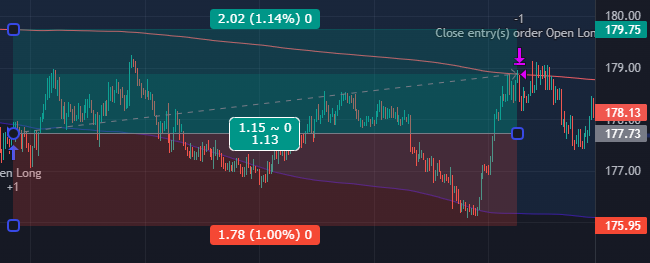
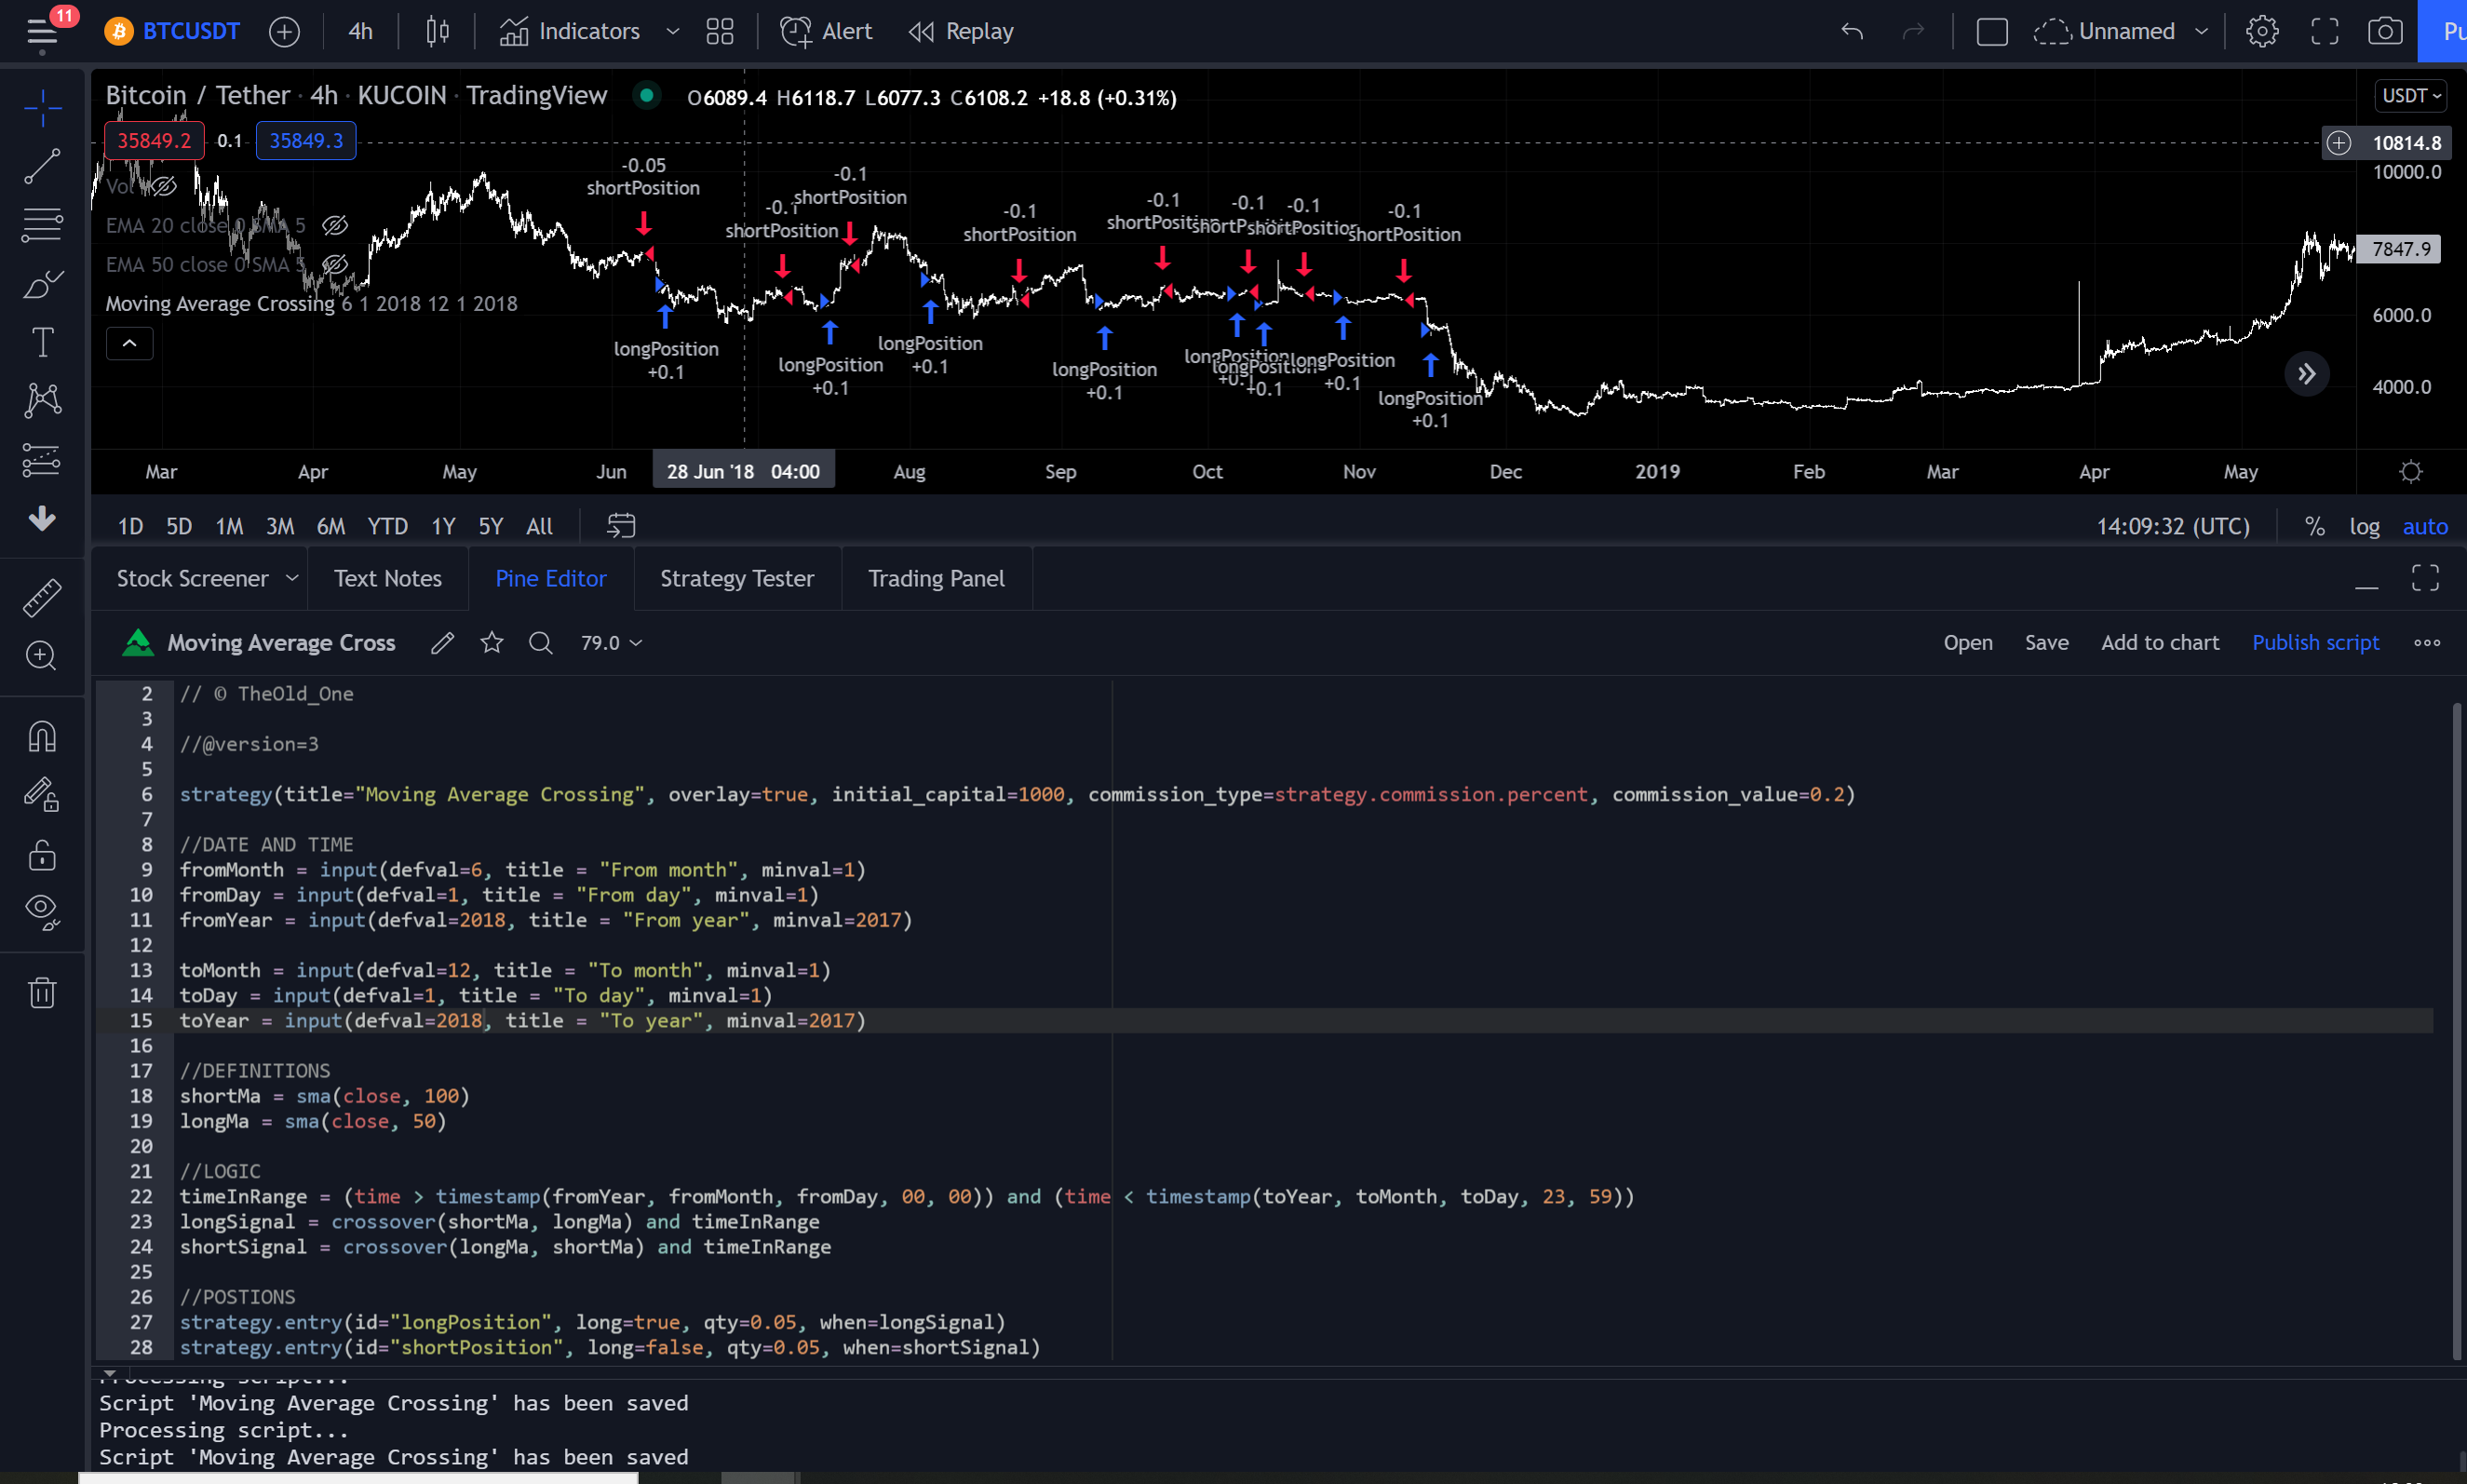
The code and screenshot are below:

Cheers,

// This source code is subject to the terms of the Mozilla Public License 2.0 at https://mozilla.org/MPL/2.0/
// ---------------------------© paaax----------------------------
// --------------------------------------------------------------
// ---------------- Author: Pascal Simon (paaax) ----------------
// --------------------------------------------------------------
// -------------------- www.pascal-simon.de ---------------------
// --------------------------------------------------------------
// ---------------- www.tradingview.com/u/paaax/-----------------
// --------------------------------------------------------------
// Source: https://gist.github.com/L-A/3497902#file-moonobject-js
// --------------------------------------------------------------
//@version=4

strategy(“My Strategy”, overlay=true, margin_long=100, margin_short=100)

//Test time range
fromDay = input(defval=1, title=“From day”, minval=1)
fromMonth = input(defval=1, title=“From month”, minval=1)
fromYear = input(defval=2018, title=“From year”, minval=2008)

toDay = input(defval=1, title=“To day”, minval=1)
toMonth = input(defval=1, title=“To month”, minval=1)
toYear = input(defval=2018, title=“To year”, minval=2008)

// Moon day offset

dayOffset = input(defval=0, title=“Moon day offset”)

shortSMA = input(defval=14, title=“shortSMA”)
longSMA = input(defval=28, title=“longSMA”)

// Configure trail stop level with input options

longTrailPerc = input(defval=3, title=“Trail Long Loss (%)”, type=input.float, minval=0.0, step=0.1) * 0.01

shortTrailPerc = input(defval=3, title=“Trail Short Loss (%)”, type=input.float, minval=0.0, step=0.1) * 0.01

fillBackground = input(true, “Fill Background?”)

// Moon Phase FUNCTION — {

normalize(_v) =>
x = _v
x := x - floor(x)
if x < 0
x := x + 1
x

calcPhase(_year, _month, _day) =>

int y = na
int m = na
float k1 = na 
float k2 = na 
float k3 = na
float jd = na
float ip = na

y := _year - floor((12 - _month) / 10)       
m := _month + 9
if m >= 12 
    m := m - 12

k1 := floor(365.25 * (y + 4712))
k2 := floor(30.6 * m + 0.5)
k3 := floor(floor((y / 100) + 49) * 0.75) - 38

jd := k1 + k2 + _day + 59
if jd > 2299160
    jd := jd - k3

ip := normalize((jd - 2451550.1) / 29.530588853)
age = ip * 29.53

//} — FUNCTION

// INIT — {

age = calcPhase(year, month, dayofmonth + dayOffset)
moon = floor(age)[1] > floor(age) ? 1 : floor(age)[1] < 15 and floor(age) >= 15 ? -1 : na

//} — INIT

//Logic

// Determine long trail stop loss price
longStopPrice = 0.0

longStopPrice := if (strategy.position_size > 0)
stopValue = close * (1 - longTrailPerc)
max(stopValue, longStopPrice[1])
else
0

// Determine trailing short price
shortStopPrice = 0.0

shortStopPrice := if (strategy.position_size < 0)
stopValue = close * (1 + shortTrailPerc)
min(stopValue, shortStopPrice[1])
else
999999

// Timerange

timeInRange = (time > timestamp(fromYear, fromMonth, fromDay, 00, 00)) and (time < timestamp(toYear, toMonth, toDay, 23, 59))

// Submit entry orders if the moon phase is favourable, the time is within the time range and the trend as defined by two SMAs is favourable
longCondition = (moon<=0) and (timeInRange) and (sma(close, shortSMA) > sma(close, longSMA))
if (longCondition)
strategy.entry(“My Long Entry Id”, strategy.long)

shortCondition = (moon>=0) and (timeInRange) and (sma(close, shortSMA) < sma(close, longSMA))
if (shortCondition)
strategy.entry(“My Short Entry Id”, strategy.short)

// Submit exit orders for trail stop loss price
if (strategy.position_size > 0)
strategy.exit(id=“XL TRL STP”, stop=longStopPrice)

if (strategy.position_size < 0)
strategy.exit(id=“XS TRL STP”, stop=shortStopPrice)

1 Like

HI,

I’m working on strategy where I want to close my position when the price reaches the SMA. BUT it has to be the price where the SMA was at when I opened my position.

image

As you can see it closed when price crossed the SMA (in red), my target should the SMA price at opening of the trade. Who can help?

1 Like

2nd question : I want to use a risk/reward ratio of 3 on all trades so I need to have my stop at -33% of the target. How could I program that?

Problem 1 solved :slight_smile:

bspo = ta.barssince(strategy.position_size > 1)
TP1 = ta.valuewhen(LongEnter[bspo],mdl,0)

if LongEnter
strategy.entry(‘Long’, direction=strategy.long, limit=TP1)

Format: month/day/year
06/01/2021 - 08/01/2021

08/01/2021 - 10/01/2021

CODE

//@version=4
strategy(title="Test", overlay = true, initial_capital=1000, commission_type = strategy.commission.percent, commission_value = 0.2)

// Date and Time
fromMonth = input(defval = 6, title = "From month", minval = 1)
fromDay = input(defval = 1, title = "From day", minval = 1)
fromYear = input(defval = 2021, title = "From year", minval = 2014)

toMonth = input(defval = 8, title = "To month", minval = 1)
toDay = input(defval = 1, title = "To day", minval = 1)
toYear = input(defval = 2021, title = "To year", minval = 2014)

timeInRange = (time > timestamp(fromYear, fromMonth, fromDay, 00, 00)) and (time < timestamp(toYear, toMonth, toDay, 23, 59))


ma50 = sma(close, 50)
ma10 = sma(close, 10)
ma20 = sma(close, 20)
ma100 = sma(close, 100)
ma200 = sma(close, 200)
longCondition = timeInRange and crossover(ma10, ma100) or timeInRange and crossover(ma10, ma20) and rsi(close, 14) < 50 or timeInRange and crossover(ma10, ma200)
shortCondition = timeInRange and crossover(ma100, ma10)//and timeInRange or crossover(ma20, ma10) and timeInRange
sellLong = crossover(ma20, sma(close, 50)) 
sellShort = close < ma20

strategy.entry("long", true, 1, when=longCondition)
strategy.close("long", when=sellLong)

strategy.entry("short", false, 1, when=shortCondition)
strategy.close("short", when=sellShort)

1 Like

1 Like

Oops, I initially posted that on the wrong forum about strategy discussion:
Hi everyone,

I started trying to run filip’s code which is a good thing as it made me realise some renaming of functions or arguments have been done since the version of pine script has changed (adding ta. to technical analysis functions, input.int to be used it seems, etc.)
Then, I am not saying I am particularly creative, I tried the crossover ema 50/100, which gives good results on some datasets of 6 months but not all (not surprising 2021 datasets give better results, not true for first 4 months 2022)- I am also trying to play with the timeframe, I assume the code takes the timeframe chosen in the view and calculates the ema(s) based on the timeframe chosen, so I guess the same code gives a different result depending on the timeframe of the view - I also assume there must be a way to specify the timeframe directly in the code - I am still trying but anyway here is the code to at least share what I tried to apply so far -:

//@version=5

strategy(title="Moralis course",overlay=true,initial_capital=2000, commission_type= strategy.commission.percent, commission_value=0.2)

//Date and time
fromMonth= input.int(defval=1, title = "From month", minval=1)
fromDay= input.int(defval=1, title= "From day", minval=1)
fromYear= input.int(defval=2019, title = "From year", minval=2014)

toMonth= input.int(defval=1, title = "To month", minval=1)
toDay= input.int(defval=1, title= "To day", minval=1)
toYear= input.int(defval=2025, title = "To year", minval=2014)


//Definitions
shortMa = ta.ema(close,50)
longMa = ta.ema(close,100)


//Logic
timeinRange=(time>timestamp(fromYear, fromMonth,fromDay,00,00)) and (time<timestamp(toYear, toMonth,toDay,00,00))
longSignal = ta.crossover(shortMa,longMa) and timeinRange
shortSignal = ta.crossover(longMa,shortMa)and timeinRange

//Positions
strategy.entry("longPosition", strategy.long, when=longSignal)
strategy.entry("shortPosition", strategy.short, when=shortSignal)

type or paste code here

Managed to stay profitable between 3 data sets and the most recent price volatility with the initial code. Added RSI and i need to add risk and stoploss.

//DATA SETS
3,15,2021 5,15,2021
1,1,2022 5,29,0222
3,1,2022 5,29,2022

//@version=3

strategy(title="Moving Average Crossing", overlay=true, initial_capital=300, commission_type=strategy.commission.percent, commission_value=0.2)

//DATE AND TIME
fromMonth = input(defval=3, title = "fromMonth", minval=1)
fromDay = input(defval=15, title = "fromDay", minval=1)
fromYear = input(defval=2021, title = "fromYear", minval=2014)

toMonth = input(defval=5, title = "toMonth", minval=1)
toDay = input(defval=15, title = "toDay", minval=1)
toYear = input(defval=2021, title = "toYear", minval=2014)

//DEFINITION
shortMa = sma(close,15)
longMa = sma(close, 45)
r= rsi(close,14)

//LOGIC
timeInRange = (time > timestamp(fromYear, fromMonth, fromDay, 00, 00)) and (time < timestamp(toYear, toMonth, toDay,23,59))
longSignal = crossover(shortMa, longMa) and timeInRange and r < 50
shortSignal = crossover(longMa, shortMa) and timeInRange and r > 50

//POSITION
strategy.entry(id="longPosition", long=true, qty=.01,when=longSignal)
strategy.entry(id="shortPosition", long=false, qty=.01, when=shortSignal)

1 Like

i tried the SMA but found that I could slightly improve it;
however i moved to plot with MACD:

//@version=3

strategy(title="My MACD Strategy", overlay=true, initial_capital=2000, commission_type=strategy.commission.percent,  commission_value=0.2)

//Time and Date
fromMonth= input(defval=1, title="From Month", minval=1)
fromDay= input(defval=8, title="From Day", minval=1)
fromYear= input(defval=2014, title="From Year", minval=2014)

toMonth= input(defval=11, title="To Month", minval=1)
toDay= input(defval=15, title="To Day", minval=1)
toYear= input(defval=2019, title="To Year", minval=2014)

// Definitions

// inputs macd
fastLen = input(title="Fast Length", type=integer, defval=10) //macd
slowLen = input(title="Slow Length", type=integer, defval=21) //macd
sigLen  = input(title="Signal Length", type=integer, defval=9) //macd

// Get MACD values
[macdLine, signalLine, _] = macd(close, fastLen, slowLen, sigLen)
hline(price=0)


// logic SMA
timeinRange = (time > timestamp(fromYear,fromMonth, fromDay,00,00)) and (time < timestamp(toYear, toMonth, toDay, 23, 59))


// logic MACD
longCondition  = crossover(macdLine, signalLine)
shortCondition = crossunder(macdLine, signalLine)


// strategy with macd
strategy.entry(id="Long Entry", long=true, when=longCondition)
strategy.entry(id="Short Entry", long=false, when=shortCondition)

i get better results when adjusting to weekly however I can’t find the way for making sure that macd values are using weekly numbers
daily - results with 1100% profit


weekly - results with 2000% profit

in any case; hodling is best! :slight_smile:

1 Like

first strategy (from 01/06/2021 to 28/12/2021)

Code:

//@version=4 strategy(title="MA crossing", overlay=true, initial_capital= 500, commission_type= strategy.commission.percent, commission_value=0.2)

//DATE AND TIME
fromMonth = input(defval = 6, title=“from month”, minval=1)
fromDay = input(defval = 1, title=“from day”, minval=1)
fromYear = input(defval = 2021, title =“From year”, minval=2014)

// to which date and time

toMonth = input(defval = 12, title=“to month”, minval=1)
toDay = input(defval = 28, title=“to day”, minval=1)
toYear = input(defval = 2021, title =“to year”, minval=2014)

//DEFINITIONS
shortma = sma(close,36)
longma = sma(close,50)
r=rsi(close,14)

//LOGIC
timeInRange = (time > timestamp(fromYear, fromMonth, fromDay, 00, 00)) and (time < timestamp(toYear,toMonth,toDay, 23, 59))
shortsignal= crossover(longma, shortma) and timeInRange and r>50
longsignal= crossover(shortma, longma) and timeInRange and r<50

//POSITIONS
strategy.entry(id=“longposition”, long = true, qty=0.1, when = longsignal )
strategy.entry(id=“shortposition”, long = false, qty=0.1, when = shortsignal )


Using the same code, the only difference is the data used to train our bot.

//@version=4 strategy(title="MA crossing", overlay=true, initial_capital= 500, commission_type= strategy.commission.percent, commission_value=0.2)

//DATE AND TIME
fromMonth = input(defval = 1, title=“from month”, minval=1)
fromDay = input(defval = 1, title=“from day”, minval=1)
fromYear = input(defval = 2022, title =“From year”, minval=2014)

// to which date and time

toMonth = input(defval = 6, title=“to month”, minval=1)
toDay = input(defval = 28, title=“to day”, minval=1)
toYear = input(defval = 2022, title =“to year”, minval=2014)

//DEFINITIONS
shortma = sma(close,36)
longma = sma(close,50)
r=rsi(close,14)

//LOGIC
timeInRange = (time > timestamp(fromYear, fromMonth, fromDay, 00, 00)) and (time < timestamp(toYear,toMonth,toDay, 23, 59))
shortsignal= crossover(longma, shortma) and timeInRange and r>50
longsignal= crossover(shortma, longma) and timeInRange and r<50

//POSITIONS
strategy.entry(id=“longposition”, long = true, qty=0.1, when = longsignal )
strategy.entry(id=“shortposition”, long = false, qty=0.1, when = shortsignal )

The result is as follows:

By this we can say that our bot was curved fitted into the previous set of data (from 01/06/2022 to 28/12/2022). So, we took some measures to make them profitable regarding the data used. The next profitable bot discover was the following one.

Code:

//@version=4 strategy(title="MA crossing", overlay=true, initial_capital= 500, commission_type= strategy.commission.percent, commission_value=0.2)

//DATE AND TIME
fromMonth = input(defval = 1, title=“from month”, minval=1)
fromDay = input(defval = 1, title=“from day”, minval=1)
fromYear = input(defval = 2021, title =“From year”, minval=2014)

// to which date and time

toMonth = input(defval = 6, title=“to month”, minval=1)
toDay = input(defval = 1, title=“to day”, minval=1)
toYear = input(defval = 2021, title =“to year”, minval=2014)

//DEFINITIONS
shortma = sma(close,36)
longma = sma(close,50)
r=rsi(close,14)
fastinput = input(12, “Fast length”)
slowinput = input(26, “Slow length”)
[macdline, signalline, histline] = macd(close, fastinput, slowinput, 9)

//LOGIC
timeInRange = (time > timestamp(fromYear, fromMonth, fromDay, 00, 00)) and (time < timestamp(toYear,toMonth,toDay, 23, 59))
shortsignal= crossover(longma, shortma) and timeInRange and r>50 and histline < 0
longsignal= crossover(shortma, longma) and timeInRange and r<50 and histline > 0
//POSITIONS
strategy.entry(id=“longposition”, long = true, qty=0.1, when = longsignal )
strategy.entry(id=“shortposition”, long = false, qty=0.1, when = shortsignal )


and the next set of data gave us the following results:

As we can see both of the data set we input were very profitable Disclaimer: This is for learning purposes, NOT TRADING TOOL
1 Like

Due to the free version of trading view I can only seem to be able to use an hourly data set within 2022.

strategy(title="Moving Average Crossing - dataset1", overlay=true, initial_capital=2000, commission_type=strategy.commission.percent, commission_value=0.2)

//Date And Time
fromMonth = input.int(defval=2, title="From month", minval=1)
fromDay = input.int(defval=15, title="From day", minval=1)
fromYear = input.int(defval=2022, title="From year", minval=2014)

toMonth = input.int(defval=5, title="To month", minval=1)
toDay = input.int(defval=15, title="To day", minval=1)
toYear = input.int(defval=2022, title="From year", minval=2014)

//Definitions
shortMa = ta.sma(close, 42)
longMa = ta.sma(close, 50)
r = ta.rsi(close, 14)

//Logic
timeRange = (time > timestamp(fromYear, fromMonth, fromDay, 0, 0)) and (time < timestamp(toYear, toMonth, toDay, 23, 59)) 
longSignal = ta.crossover(shortMa, longMa) and timeRange and r > 50 and volume > 90
shortSignal = ta.crossover(longMa, shortMa) and timeRange and r < 40 and volume > -10

//Positions
strategy.entry("longPosition", strategy.long, qty=0.1, when=longSignal)
strategy.entry("shortPosition", strategy.short, qty=0.1, when=shortSignal)

// Second Data set

strategy(title="Moving Average Crossing - dataset1", overlay=true, initial_capital=2000, commission_type=strategy.commission.percent, commission_value=0.2)

//Date And Time
fromMonth = input.int(defval=5, title="From month", minval=1)
fromDay = input.int(defval=15, title="From day", minval=1)
fromYear = input.int(defval=2022, title="From year", minval=2014)

toMonth = input.int(defval=8, title="To month", minval=1)
toDay = input.int(defval=15, title="To day", minval=1)
toYear = input.int(defval=2022, title="From year", minval=2014)

//Definitions
shortMa = ta.sma(close, 42)
longMa = ta.sma(close, 50)
r = ta.rsi(close, 14)

//Logic
timeRange = (time > timestamp(fromYear, fromMonth, fromDay, 0, 0)) and (time < timestamp(toYear, toMonth, toDay, 23, 59)) 
longSignal = ta.crossover(shortMa, longMa) and timeRange and r > 50 and volume > 90
shortSignal = ta.crossover(longMa, shortMa) and timeRange and r < 40 and volume > -10

//Positions
strategy.entry("longPosition", strategy.long, qty=0.1, when=longSignal)
strategy.entry("shortPosition", strategy.short, qty=0.1, when=shortSignal)

1 Like

I used a very easy code and a simple indicator but it looks like it works. :slight_smile:

There problem is although: with hodl tactic you make more :confused:

//@version=3
strategy(title =“Moving Average 50”, overlay =true, initial_capital=2000, commission_type = strategy.commission.percent, commission_value = 0.2)

//Date and Time
fromMonth = input(defval =12, title =“From month”,minval=1)
fromDay = input(defval =1, title =“From day”,minval=1)
fromYear = input(defval =2018, title =“From year”,minval=2014)

toMonth = input(defval =5, title =“To month”,minval=1)
toDay = input(defval =1, title =“To day”,minval=1)
toYear = input(defval =2019, title =“To year”,minval=2014)

//Definitions
m = sma(close, 50)

//Logic
timeInRange =(time > timestamp(fromYear, fromMonth, fromDay, 00, 00)) and (time < timestamp(toYear, toMonth, toDay, 23,59))
buy = close > m and timeInRange
sell = close < m and timeInRange

//Positions
strategy.entry(“buy”, true, 0.1, when=buy)
strategy.close(“buy”, when=sell)

1 Like
//@version=4
strategy(title="MACrossing", overlay=true, initial_capital = 1000, commission_type = strategy.commission.percent, commission_value = 0.2)

//Date and Time
fromMonth =input(defval=1, title="From Month", minval=1)
fromDay =input(defval=1, title="From Day", minval=1)
fromYear =input(defval=2022, title="From Year", minval=2014)

toMonth =input(defval=1, title="To Month", minval=1)
toDay =input(defval=1, title="To Day", minval=1)
toYear =input(defval=2025, title="To Year", minval=2014)

//Definitions
shortMA = sma(close, 45)
longMA = sma(close, 50)
r = rsi(close, 14)

//Logic
timeInRange=(time > timestamp(fromYear, fromMonth, fromDay, 00, 00)) and (time < timestamp(toYear, toMonth, toDay, 23, 55))
longSignal = crossover(shortMA, longMA) and timeInRange and r < 50 and volume > 5000
shortSignal = crossover(longMA, shortMA) and timeInRange and r > 50 and volume > 5000

//Positions
strategy.entry(id = "longPosition", long = true, qty = 1, when = longSignal)
strategy.entry(id = "shortPosition", long = false, qty = 1, when = shortSignal)

I am currently just experimenting with different values. What i find interesting is that in the timeframe from 1.1.2021 unti 1.1.2025 i am in profit with around 280%
But if I set the date for the timeframe 1.1.2020 to 1.1.2025 I am loosing around -63%. Maybe this strategy works well in the current market but doesn´t work well during bull runs.
I also tested it with other stocks and coins and had similar results.

1 Like

Strategy attempting to find 4 year cycle lows for btc and place orders (up to 3) near the cycle lows. When in bull market, long positions produced similar results over 2 time frames and work well. But strategy is maybe too long term. Shorts when moving into the 4 year bear cycle did not work as intended and needs adjustments.

//@version=5
strategy(title="STC and SMA Strategy", overlay=true, initial_capital=5000, commission_type=strategy.commission.percent, commission_value=0.2, pyramiding=3)

// DATE AND TIME (with default values set to 1-1-2023 to 10-10-2024)
fromMonth = input.int(defval=1, title="From month", minval=1, maxval=12)
fromDay = input.int(defval=1, title="From day", minval=1, maxval=31)
fromYear = input.int(defval=2023, title="From year", minval=2011, maxval=2025)

toMonth = input.int(defval=12, title="To month", minval=1, maxval=12)
toDay = input.int(defval=31, title="To day", minval=1, maxval=31)
toYear = input.int(defval=2023, title="To year", minval=2011, maxval=2025)

// Schaff Trend Cycle settings
fastLength = input.int(23, title="MACD Fast Length")
slowLength = input.int(50, title="MACD Slow Length")
cycleLength = input.int(10, title="Cycle Length")
d1Length = input.int(3, title="1st %D Length")
d2Length = input.int(3, title="2nd %D Length")
src = input.source(close, title="Source")
lowerBand = input.int(25, title="Lower Band")
upperBand = input.int(75, title="Upper Band")

// Schaff Trend Cycle calculation
macd = ta.ema(src, fastLength) - ta.ema(src, slowLength)
k = ta.stoch(macd, macd, macd, cycleLength)
d = ta.ema(k, d1Length)
kd = ta.stoch(d, d, d, cycleLength)
stc = ta.ema(kd, d2Length)
stc := math.max(math.min(stc, 100), 0)

//Definitions
max_risk = strategy.equity * 0.02
stoploss = 1200
size = max_risk/stoploss
takeProfit = 5000
sma200 = ta.sma(close, 120)
priceBelowSMA200 = close < sma200

// Trading logic
timeInRange = (time > timestamp(fromYear, fromMonth, fromDay, 00, 00)) and (time < timestamp(toYear, toMonth, toDay, 23, 59))
longSignal = ta.crossover(stc, lowerBand) and timeInRange
shortSignal = ta.crossunder(upperBand, stc) and timeInRange

//POSITION
strategy.entry(id="longPosition", direction=strategy.long, qty=size, when=longSignal)


strategy.exit("Exit Long", from_entry="longPosition", loss=stoploss*100, profit=takeProfit*100, when=priceBelowSMA200)