
Trading View wouldn’t let me add the code to the chart because it said limited to 3 indicators. I also kept getting an error when trying to add to chart. I will have to practice this a lot. My main goal with doing the Algo Trading course is to have an understanding of how to create better strategies. I wouldn’t feel confident in making a bot at this point. I will keep studying, do the Java course too and then revisit this exercise.
1 Like
You might just have to remove some of the other indicators, since the free account have 3 indicators at the same time top.

Carlos Z
1 Like
I’m not into programming though I listen to some BTC & altcoin traders who do regular technical analysis on the crypto market so I thought this course would be a cinch. Not so! Though not an active trader, I have applied my personal strategy when to get in (in times of fear) or out (greed) of the market, without having to ‘program’ or ‘code’ the strategy. It’s hard to believe someone like me, with no prior programming knowledge or experience, could come up with “simple” strategies that Filip just automatically writes on the class, without explaining how those codes came out to be, so listening does not make me process the info fast enough. Also can’t believe how the programs submitted here were completed based on a 5- to 10-minute lecture, not even from a reference manual on Pinescript. It’s not how I expect to learn. I’m lost when I check the variety of replies that seem to go at different tangents. I honestly don’t think a market as volatile as the crypto market could be beaten by a trading algorithm and tend to go by gut feeling that worked so far.
A platform such as tradingview.com for our own study practice does not help since we would have to get a paid account in order to test the various indicators mentioned in class, which are not functional with a free account that is limited by 3 indicators on the same chart. It’s frustrating to get nowhere or an error message when I click “Add to Chart”. I am not interested to get a paid version just for practice purposes at this point. I’d rather use an alternative, free platform that is not too limited in terms of (learning or testing) options.
I will simply continue learning a lot, proceed to the next lesson to get more info and work done, and maybe something clicks later on since who wouldn’t want to create a winning algorithmic strategy any time soon?
1 Like
Hello,
my idea is the following:
ASSET: btc
ENTRY LONG: if (close > moving average 50 periods) set buy stop at the highest HIGH of the previous 10 candles
STOP LONG: at level of BUY STOP - ATR(22)*2
ENTRY SHORT: if (close < moving average 50 periods) set sell stop at the LOWEST LOW of the previous 10 candles
STOP SHORT: at level of SELL STOP + ATR(22)*2
if an ENTRY LONG is open and an ENTRY SHORT gets triggered the long order should be automatically closed even if it didn’t get the stop loss (so it’s a kind of take profit)
anyway this should happen only if at least 10 DAYS have passed from the opening of the ENTRY LONG.
below the programming.
I have 2 doubts:
-
if the price goes over the MA 50 periods on 10.01.2021 i want to set a buy stop at the highest hig of the last 10 candles (which is for example on 02.01.2021. It seems to me that as i programmed this highest high will be movnig day by day and will not be fixed at the high of 02.01.2021.
How can I get this fixed? -
I’m stuck when trying to open a short trade only after a long trade has been open for at least 10 days (so I avoid to open a long trade and close it the day after because the price goes immidiately under the MA). How can I program this?
//@version=4
strategy(title="moving averate", overlay=true, initial_capital=2000, commission_type=strategy.commission.percent, commission_value=0.2) //COMMISSIONI 0,2% A TRADE

fromMonth=input(defval=1, title="fromMonth", minval=1)
fromDay=input(defval=1, title="fromDay", minval=1)
fromYear=input(defval=2012, title="fromDay", minval=2012)

toMonth=input(defval=1, title="toMonth", minval=1)
toDay=input(defval=1, title="toDay", minval=1)
toYear=input(defval=2025, title="toDay", minval=2012)


//DEFINITIONS

MA = sma(close, 50)
maxRisk = strategy.equity * 0.01 // definisco max rischio come 1% del mio portfolio
stopLoss = 100
size = maxRisk / stopLoss // maxRisk diviso il massimo SL

//LOGIC
timeInRange = (time > timestamp(fromYear, fromMonth, fromDay, 00, 00)) and (time < timestamp(toYear, toMonth, toDay, 23, 59))
long=close > MA
short=close < MA

//POSITIONS
strategy.entry(id="compra", long=true, stop=max(high[1],high[2],high[3], high[4],high[5], high[6],high[7],high[8],high[9]), qty= 1, when=long) // size = 0.1 BTC PER TRADE
strategy.entry(id="vendi", long=false, stop=min(high[1],high[2],high[3], high[4],high[5], high[6],high[7],high[8],high[9]), qty= 1, when=short) // qty = size -> me la cambia ogni volta e non è fisso come 0.1

strategy.exit("chiudi compra", from_entry="compra", loss=(max(high[1],high[2],high[3], high[4],high[5], high[6],high[7],high[8],high[9])-atr(22)*2)*100)

strategy.exit("chiudi vendi", from_entry="vendi", loss=(min(high[1],high[2],high[3], high[4],high[5], high[6],high[7],high[8],high[9])+atr(22)*2)*100) // profit = 200000 profit è TP
thanks a lot
The free version of Tradeviewer only allows the current year, so I tested 2021 from Jan. to June and the MA 20 and MA 50 did well. No idea if it works on another timeframe

hello i’m trying to do a strategy with pivot points. I create an indicator working in H1 with DAILY pivot points.
I’m stuck with this two points:
-
I don’t understand why from day 1 to the next one (day 2) the change in the pivot is not vertical but it’s a diagonal line (in this way i don’t understand which level of pivot is it considered in the last hour of the day)
-
if my strategy is to BUY when price crossover the pivot level (blue one) and set a STOP LOSS on the S1 level (the first under the pivot, in red).
in this way the stop loss would change the next day because the S1 level change every day.
How can I keep the stop loss fixed to the S1 level of the same day when I open the position? avoiding change in the stop loss in the next day?
thanks 

this is my script
// This source code is subject to the terms of the Mozilla Public License 2.0 at https://mozilla.org/MPL/2.0/
// © enricofabris

//@version=4
study("My Script", overlay= true)

settimanali = input(title=" settimanali visibili?", type=input.bool, defval=true)
giornalieri = input(title=" giornalieri visibili?", type=input.bool, defval=true)

g(e) => security(syminfo.tickerid, "1W", e, lookahead=barmerge.lookahead_on)

H = g(high[1])
L = g(low[1])
C = g(close[1])
P = (H + L + C) / 3
R1 = (P * 2) - L
R2 = P + (H - L)
R3 = R2 + (H - L)
S1 = (P * 2) - H
S2 = P - (H - L)
S3 = S2 - (H - L)

//PUNTI PIVOT DAILY

f(i) => security(syminfo.tickerid, "1D", i, lookahead=barmerge.lookahead_on)

h = f(high[1])
l = f(low[1])
c = f(close[1])
p = (h + l + c) / 3
r1 = (p * 2) - l
r2 = p + (h - l)
r3 = r2 + (h - l)
s1 = (p * 2) - h
s2 = p - (h - l)
s3 = s2 - (h - l)


plot(settimanali ? P : na, color=color.blue, linewidth=3)
plot(settimanali ? R1 : na, color=color.green, linewidth=3)
plot(settimanali ? R2 : na, color=color.green, linewidth=3)
plot(settimanali ? S1 : na, color=color.red, linewidth=3)
plot(settimanali ? S2 : na, color=color.red, linewidth=3)
plot(settimanali ? R3 : na, color=color.green, linewidth=3)


plot(giornalieri ? p : na, color=color.blue)
plot(giornalieri ? r1 : na, color=color.green)
plot(giornalieri ? s1 : na, color=color.red)
plot(giornalieri ? r2 : na, color=color.green)
plot(giornalieri ? s2 : na, color=color.red)
1 Like
strategy(title="Moving Average Crossing Test", overlay=true, initial_capital=2000, commission_type=strategy.commission.percent, commission_value=0.2)


//DATE AND TIME
fromMonth = input(defval=1, title = "From Month", minval=1)
fromDay = input(defval=1, title = "From Day", minval=1)
fromYear = input(defval=2020, title = "From Year", minval=2014)

toMonth = input(defval=6, title = "To Month", minval=1)
toDay = input(defval=1, title = "To Day", minval=1)
toYear = input(defval=2021, title = "To Year", minval=2014)


//DEFINITIONS
shortMa = sma(close, 13)
longMa = sma(close, 200)


//LOGIC
timeInRange = (time > timestamp(fromYear, fromMonth, fromDay, 00, 00)) and (time < timestamp(toYear, toMonth, toDay, 23, 59))
longSignal = crossover(shortMa, longMa) and timeInRange
shortSignal = crossover(longMa, shortMa) and timeInRange

//POSITIONS
strategy.entry(id="longPosition", long=true, qty=0.1, when=longSignal)
strategy.entry(id="shortPosition", long=false, qty=0.1, when=shortSignal)

1 Like

//@version=4
strategy(title=“Simple MACD histogram strategy”, overlay=true, initial_capital=2000, commission_type=strategy.commission.percent, commission_value=0.2)
//Date and time to back test the strategy
fromMonth = input(defval=1, title=“From month”, minval=1)
fromDay = input(defval=1, title=“From day”, minval=1)
fromYear = input(defval=2018, title=“From year”, minval=2014)
toMonth = input(defval=12, title=“To month”, minval=1)
toDay = input(defval=31, title=“To day”, minval=1)
toYear = input(defval=2018, title=“To year”, minval=2014)
//Definition of MACD array
[macdline, signalline, macdhist] = macd(close,12,26,9)
//Logic for going long and closing position
timeInRange = (time > timestamp(fromYear, fromMonth, fromDay, 00, 00)) and (time < timestamp(toYear, toMonth, toDay, 23, 59))
longSignal = crossover(macdhist,100) and timeInRange
closeSignal = crossunder(macdhist,100) and timeInRange
//Rules for entering positions
strategy.entry(id=“longPosition”, long=true, qty=0.1, when=longSignal)
strategy.close(id=“longPosition”, when=closeSignal)
1 Like
Tried this out on Bitcoin and Litecoin, in between 1 min. & 1 hr. Is where it improves for the most part compared to Filip’s example in the video, most notably being Bitcoin having the most accurate portrayal of how I thought my strategy would function. The initial capital was $2,000 and only buying a very small amount (0.1 of an instrument) and selling off the same amount when the stop loss trigger is hit. Let me know what I can tweak or make better through revisiting the solution, thank you this was a lot of fun!

strategy(title = "Practice Func.", overlay = true, initial_capital = 2000, commission_type = "strategy.commission.percent", commission_value = 0.2)

//Date & Time
fromMonth = input(defval = 5, title = "From month", minval = 1)
fromDay = input(defval = 15, title = "From day", minval = 1)
fromYear = input(defval = 2015, title = "From year", minval = 2009)

toMonth = input(defval = 8, title = "To month", minval = 1)
toDay = input(defval = 11, title = "To day", minval = 1)
toYear = input(defval = 2025, title = "To year", minval = 2024)


//Definitions
shortMa = sma(close, 10)
longMa = sma(close, 80)
currPr = close

//Logic
timeinRange = (time > timestamp(fromYear, fromMonth, fromDay, 00, 00) and time < timestamp(toYear, toMonth, toDay, 23, 59))
longSignal = crossover(currPr, vwap(high)) and timeinRange
shortSignal = crossunder(currPr, vwap(low)) and timeinRange


//Positions
strategy.entry(id = "long position", long = true, qty = .1, when = longSignal)
strategy.entry(id = "shortposition", long = false, qty = .1,when = shortSignal)
1 Like


//@version=4
strategy(title=“Moving Average Crossing plus RSI”, overlay=true, initial_capital=2000, commission_type=strategy.commission.percent, commission_value=0.2)
//DATE AND TIME
fromMonth = input(defval=1, title = “From month”, minval=1)
fromDay = input(defval=1, title = “From day”, minval=1)
fromYear = input(defval=2019, title = “From year”, minval=2014)
toMonth = input(defval=1, title = “To month”, minval=1)
toDay = input(defval=1, title = “To day”, minval=1)
toYear = input(defval=2025, title = “To year”, minval=2014)
//DEFINITIONS
shortMa = sma(close, 20)
longMa = sma(close, 100)
r = rsi(close, 14)
//LOGIC
timeInRange = (time> timestamp(fromYear, fromMonth, fromDay, 00, 00)) and (time < timestamp(toYear, toMonth, toDay, 23, 59))
longSignal = crossover(shortMa, longMa) and timeInRange and r >50
shortSignal = crossover(longMa, shortMa) and timeInRange and r < 50
//POSITIONS
strategy.entry(id=“longPosition”, long=true, qty=0.1, when=longSignal)
strategy.entry(id=“shortPosition”, long=false, qty=0.1, when=shortSignal)
1 Like
hello i’m trying to do a strategy with pivot points. I create an indicator working in H1 with DAILY pivot points.
I’m stuck with this two points:
- I don’t understand why from day 1 to the next one (day 2) the change in the pivot is not vertical but it’s a diagonal line (in this way i don’t understand which level of pivot is it considered in the last hour of the day)
- if my strategy is to BUY when price crossover the pivot level (blue one) and set a STOP LOSS on the S1 level (the first under the pivot, in red).
in this way the stop loss would change the next day because the S1 level change every day.
How can I keep the stop loss fixed to the S1 level of the same day when I open the position? avoiding change in the stop loss in the next day?
thanks
this is my script
// This source code is subject to the terms of the Mozilla Public License 2.0 at https://mozilla.org/MPL/2.0/
// © enricofabris

//@version=4
study("My Script", overlay= true)

settimanali = input(title=" settimanali visibili?", type=input.bool, defval=true)
giornalieri = input(title=" giornalieri visibili?", type=input.bool, defval=true)

g(e) => security(syminfo.tickerid, "1W", e, lookahead=barmerge.lookahead_on)

H = g(high[1])
L = g(low[1])
C = g(close[1])
P = (H + L + C) / 3
R1 = (P * 2) - L
R2 = P + (H - L)
R3 = R2 + (H - L)
S1 = (P * 2) - H
S2 = P - (H - L)
S3 = S2 - (H - L)

//PUNTI PIVOT DAILY

f(i) => security(syminfo.tickerid, "1D", i, lookahead=barmerge.lookahead_on)

h = f(high[1])
l = f(low[1])
c = f(close[1])
p = (h + l + c) / 3
r1 = (p * 2) - l
r2 = p + (h - l)
r3 = r2 + (h - l)
s1 = (p * 2) - h
s2 = p - (h - l)
s3 = s2 - (h - l)


plot(settimanali ? P : na, color=color.blue, linewidth=3)
plot(settimanali ? R1 : na, color=color.green, linewidth=3)
plot(settimanali ? R2 : na, color=color.green, linewidth=3)
plot(settimanali ? S1 : na, color=color.red, linewidth=3)
plot(settimanali ? S2 : na, color=color.red, linewidth=3)
plot(settimanali ? R3 : na, color=color.green, linewidth=3)


plot(giornalieri ? p : na, color=color.blue)
plot(giornalieri ? r1 : na, color=color.green)
plot(giornalieri ? s1 : na, color=color.red)
plot(giornalieri ? r2 : na, color=color.green)
plot(giornalieri ? s2 : na, color=color.red)
1
Reply
13 DAYS LATER
![]()
strategy(title="Moving Average Crossing Test", overlay=true, initial_capital=2000, commission_type=strategy.commission.percent, commission_value=0.2)


//DATE AND TIME
fromMonth = input(defval=1, title = "From Month", minval=1)
fromDay = input(defval=1, title = "From Day", minval=1)
fromYear = input(defval=2020, title = "From Year", minval=2014)

toMonth = input(defval=6, title = "To Month", minval=1)
toDay = input(defval=1, title = "To Day", minval=1)
toYear = input(defval=2021, title = "To Year", minval=2014)


//DEFINITIONS
shortMa = sma(close, 13)
longMa = sma(close, 200)


//LOGIC
timeInRange = (time > timestamp(fromYear, fromMonth, fromDay, 00, 00)) and (time < timestamp(toYear, toMonth, toDay, 23, 59))
longSignal = crossover(shortMa, longMa) and timeInRange
shortSignal = crossover(longMa, shortMa) and timeInRange

//POSITIONS
strategy.entry(id="longPosition", long=true, qty=0.1, when=longSignal)
strategy.entry(id="shortPosition", long=false, qty=0.1, when=shortSignal)
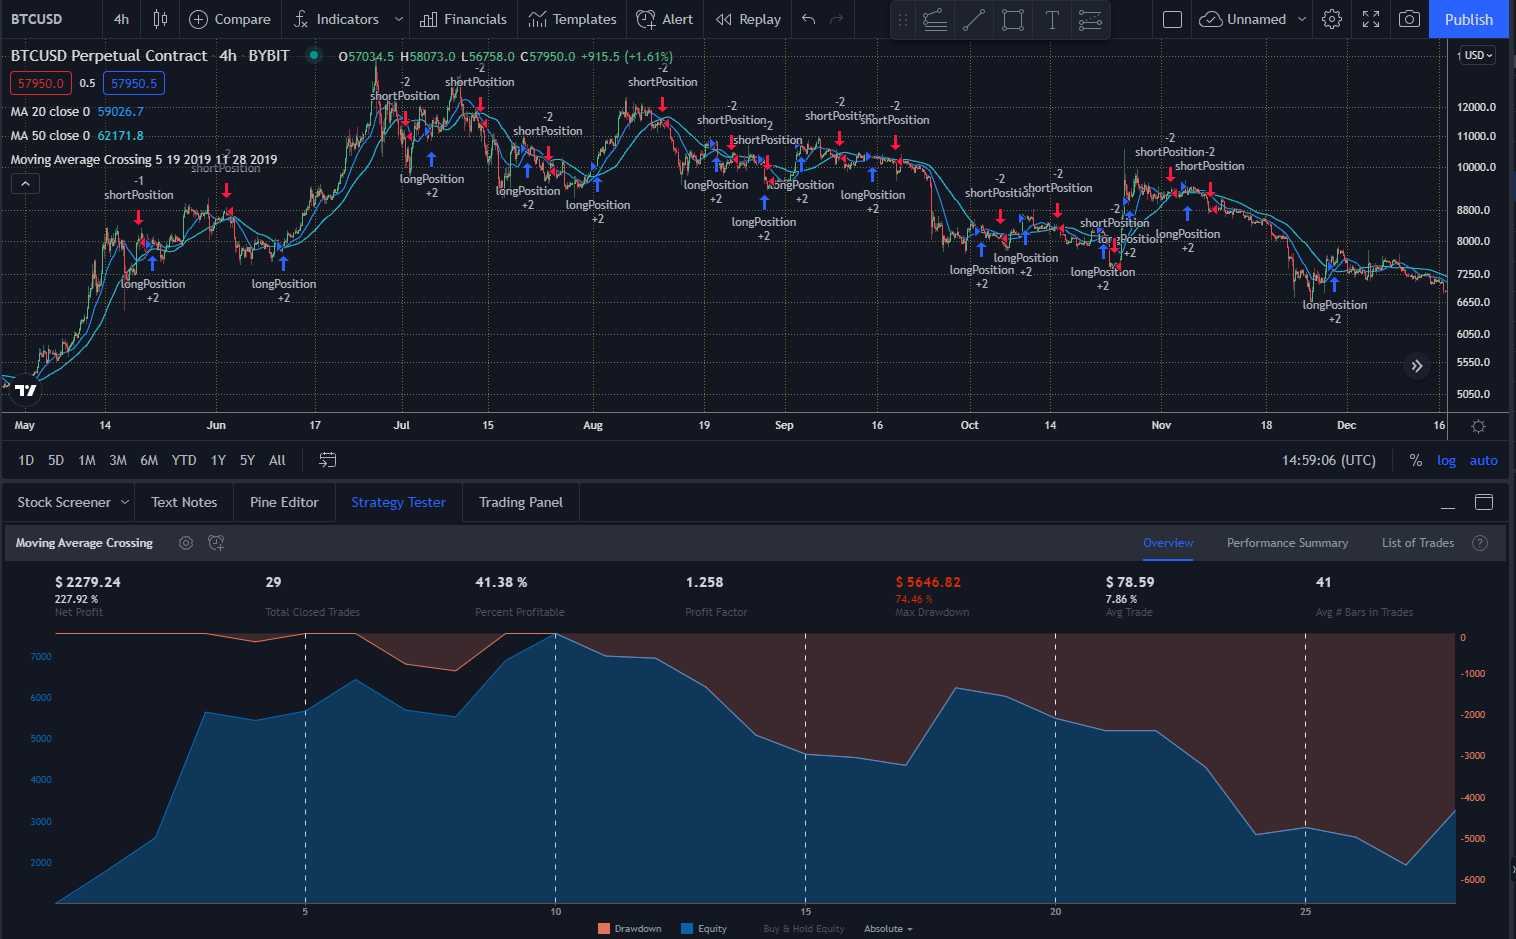
Wow! That looks really advanced. Whish I could code that well. Those are some excellent stats, have you backtested on several timeperiods?
Is it the strategy thay you use when you are trading as well?
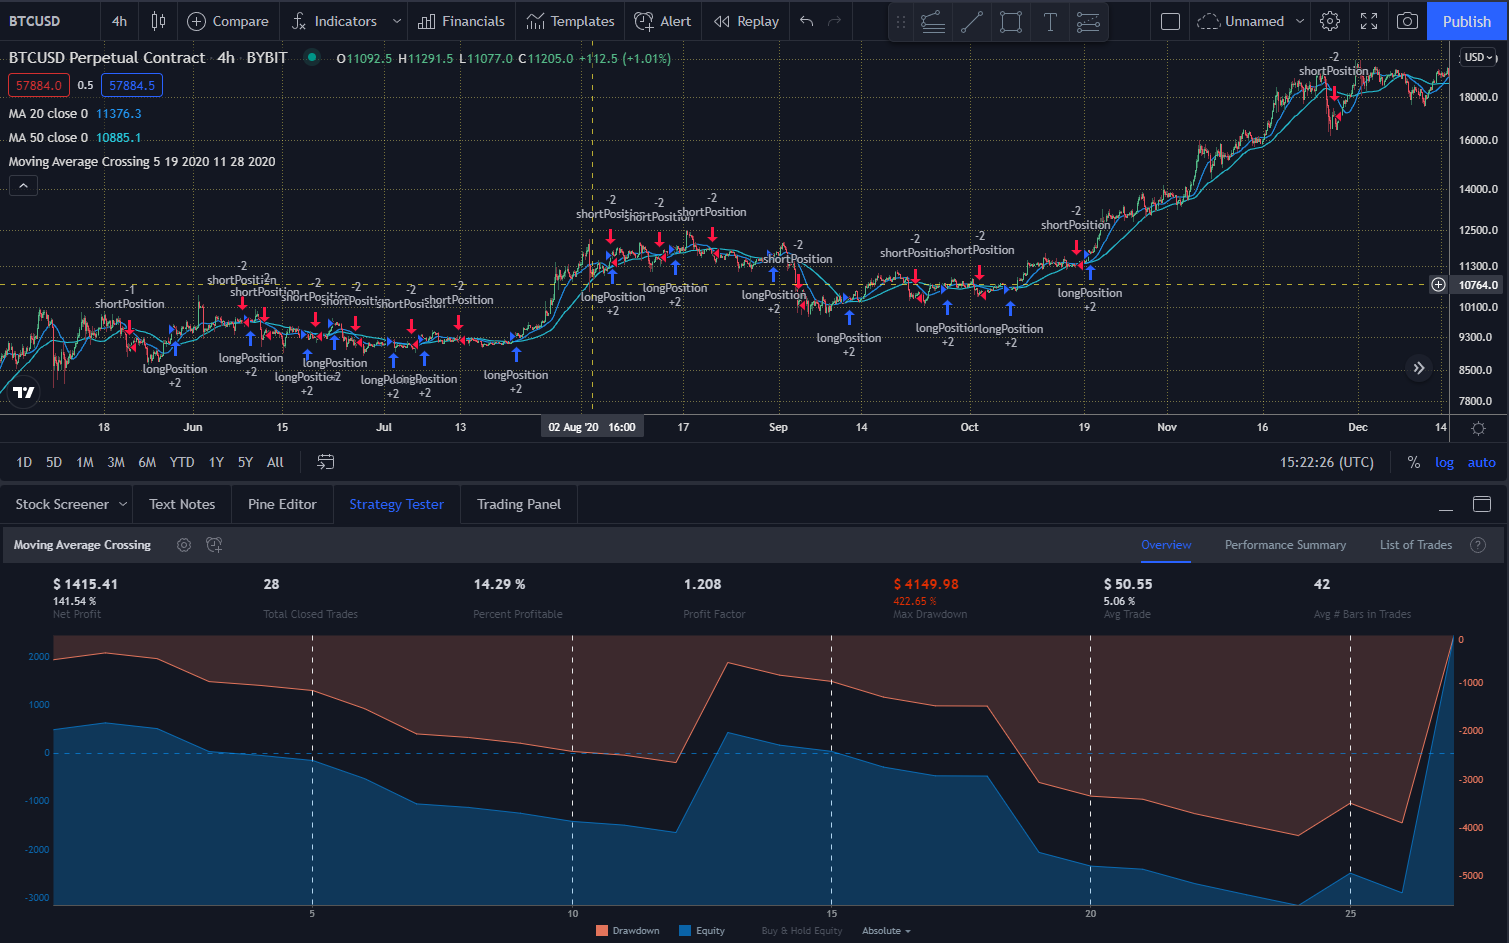
Similar to the problem a lot of others in this thread had, I was not able to access the 2019 data set on an hourly chart, so I worked with the 2021 hourly chart. First data set 01.01.2021-01.04.2021 second one 01.04.2021-01.07.2021.
Following the video and looking at the movement of the two lines, I quickly realized that I needed the short MA to be more aggressive and the long MA to be laxer, so I changed the shortMa to 10 and the longMa to 100.
Result Data Set 1 - 01.04.2021-01.07.2021
Version 1.0: Net Profit: -7.37%, $ -73.72 / Max Drawdown: 17.95% / Total Closed Trades: 45
Version 2.0: Net Profit: 12.22%, $ 122.22 / Max Drawdown: 9.54% / Total Closed Trades: 29
Result Data Set 1 - 01.01.2021-01.04.2021
Version 1.0: Net Profit: -8.22%, $ -82.16 / Max Drawdown: 21.25% / Total Closed Trades: 46
Version 2.0: Net Profit: 10.06%, $ 100.62 / Max Drawdown: 21.25% / Total Closed Trades: 30
Interestingly enough in the first Data Set, the HODLRS outperformed my strategy. Probably because of the commission fee. However, in the second Data Set, they came in at a loss while I was still able to make a profit, despite the commission fee. In both cases reducing the crossovers to avoid too many short-term trades helped increase the Net Profit.
In the future, I want to try a strategy with the Bollinger bands as one of the Trading Strategies examples in the “Technical Analysis” course showed. However, I’ll get there once I’m done with the course as it will probably take me a bit more time to wrap my head around.

2 Likes
This was interesting… I played around and smaller data sets looked fairly promising, but then implementing is on a full year, the results didn’t pan out so hot… fun exercise and figuring out how to be better with stop-loss could potentially improve this!
//@version=4
strategy(title="MA Crossing Strategy", overlay=true, initial_capital=1000, commission_type=strategy.commission.percent, commission_value=0.2)

//sma inputs
shortVal = input(defval=20, title="Short SMA", minval=1)
longVal = input(defval=80, title="Long SMA", minval=1)

//Date and Time
fromMonth = input(defval=2, title="From month", minval=1)
fromDay= input(defval=15, title="From day", minval=1)
fromYear= input(defval=2021, title="From year", minval=2014)

toMonth = input(defval=9, title="To month", minval=1)
toDay= input(defval=15, title="To day", minval=1)
toYear= input(defval=2021, title="To year", minval=2014)

tsiLong = input(title="TSI Long Length", type=input.integer, defval=25)
tsiShort = input(title="TSI Short Length", type=input.integer, defval=13)
tsiSignal = input(title="TSI Signal Length", type=input.integer, defval=13)

//Definitions
short=sma(close, shortVal)
long=sma(close, longVal)

price = close
double_smooth(src, tsiLong, tsiShort) =>
    fist_smooth = ema(src, tsiLong)
    ema(fist_smooth, tsiLong)
pc = change(price)
double_smoothed_pc = double_smooth(pc, tsiLong, tsiShort)
double_smoothed_abs_pc = double_smooth(abs(pc), tsiLong, tsiShort)
tsi_value = 100 * (double_smoothed_pc / double_smoothed_abs_pc)

//Logic
timeInRange=(time > timestamp(fromYear, fromMonth, fromDay, 00, 00)) and (time < timestamp(toYear, toMonth, toDay,23,59))

//buy=short >= long
longSignal = (crossover(short, long) or crossover(tsi_value, ema(tsi_value, tsiSignal))) and timeInRange
//sell=long >= short
shortSignal = crossover(long, short) and timeInRange

//Position
if(longSignal)
    strategy.entry(id="longPosition", long=true, qty=0.1, comment="buy")
    strategy.exit("longSignalExit", "longPosition", comment="longOut") //, profit = 5000000

if(shortSignal)
    strategy.entry(id="shortPosition", long=false, qty=0.1, comment="sell" )
    strategy.exit("exitLong", "longPosition", profit = 500000)

//Stop-Loss
strategy.exit("exitLong", "longPosition", profit = 500000) //, loss = 100000
strategy.exit("exitShort", "shortPosition", profit = 250000) //, loss = 100000
On 1 hr BTC I got:
58% NP, 45% profitable, 1.1 profit factor, 80% Max Drawdown
1hr ETH yielded: 4.83% NP, 35% profitable, 1.1 factor, 22% max drawdown
1 Like
I tried to use only long positions with RSI indicator from the beginning 2021 up until now. Profit was almost the same as just hold the position instead of trading. My strategy was (on 4 hr time frame) to enter long when RSI is bellow 30 and exit long when RSI is above 70. Results are:


and code:
//@version=4
//overlay-not using bots from previous
//include trading fee and initial capital in strategy
strategy(title="MACrossing", overlay=true, initial_capital=2000, commission_type=strategy.commission.percent, commission_value=0.2)

//DATE and TIME-from
fromMonth=input(defval=1, title="From month", minval=1)
fromDay=input(defval=1, title="From day", minval=1)
fromYear=input(defval=2021, title="From year", minval=2016)

//DATE and TIME-to
toMonth=input(defval=10, title="To month", minval=1)
toDay=input(defval=16, title="To day", minval=1)
toYear=input(defval=2021, title="To year", minval=2016)

//DEFs:
//RSI
r=rsi(close, 14)

//LOGIC
timeInRange=(time>timestamp(fromYear, fromMonth, fromDay, 00,00)) and (time<timestamp(toYear, toMonth, toDay, 23,59))
//long when shortMa crosses over longma - from beneath to above and RSI is bellow 50 and VOL >300
longSignal= timeInRange and r<30
//opposite
closeSignal= timeInRange and r>70

//POSITIONS
//long=true->long
//long=false->short
//TRDview automatically close the position when enter another entry
//qty=0.1 btc
//only longs:
strategy.risk.allow_entry_in(strategy.direction.long)
strategy.entry("longPositionOpen", long=true, qty=0.1, when=longSignal)
strategy.entry("longPositionclose",long=false, qty=0.1, when=closeSignal)
1 Like
what is TSI, and your strategy performed well on 2021 data.
// noobStrategyImprovement:
// dataSet_1
//dataSet_2
// pineCode:
I played around w/SMA value, n timeInRange till I found somethin that was better than $200 profit. still wasn’t better than buy n hold, but I’mma total noob here. V excited to grow stronger here.
1 Like
- simple enough…
- used year-long periods from 2016 through 2022
- simple enough…
i just used a different chart (the otherwise working script was no longer working on the BTC or ETH charts, so i used the ETHBTC chart) and a different metric (accumulation/distribution from the third to last day) to determine whether or not to enter/exit… i didn’t play around with the parameters too much, but the comparison between my and filip’s outcomes were most noticeable during the bearish period from 2019-2021 as seen below
his
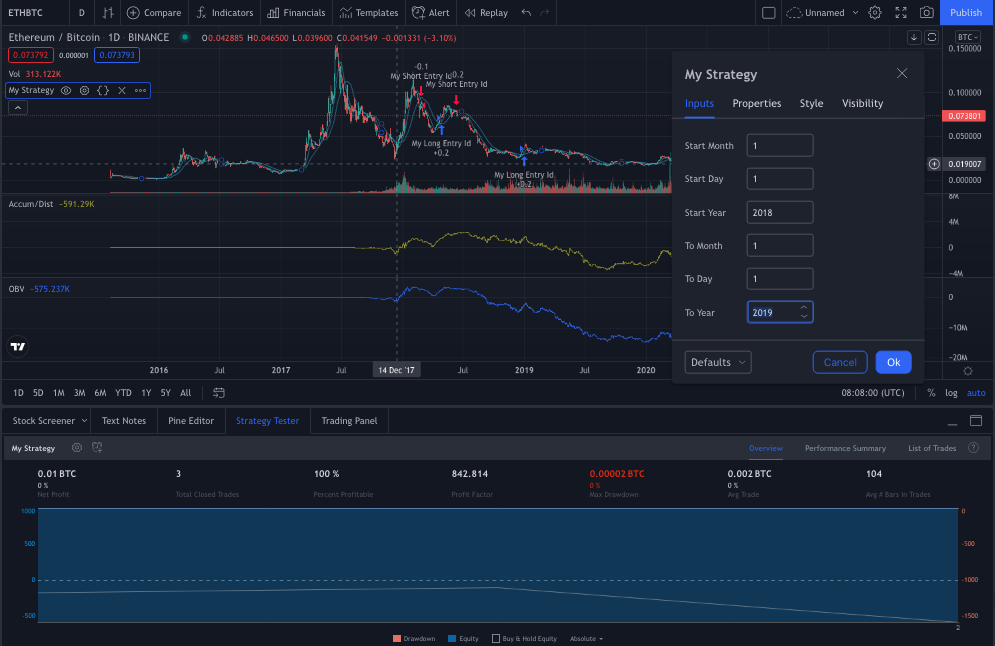
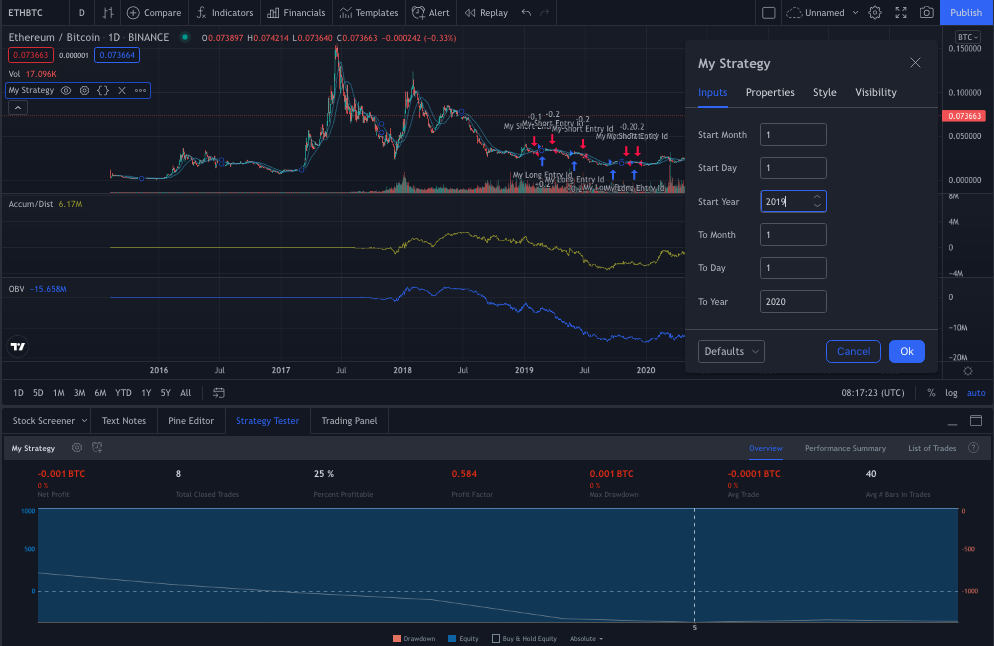
mine
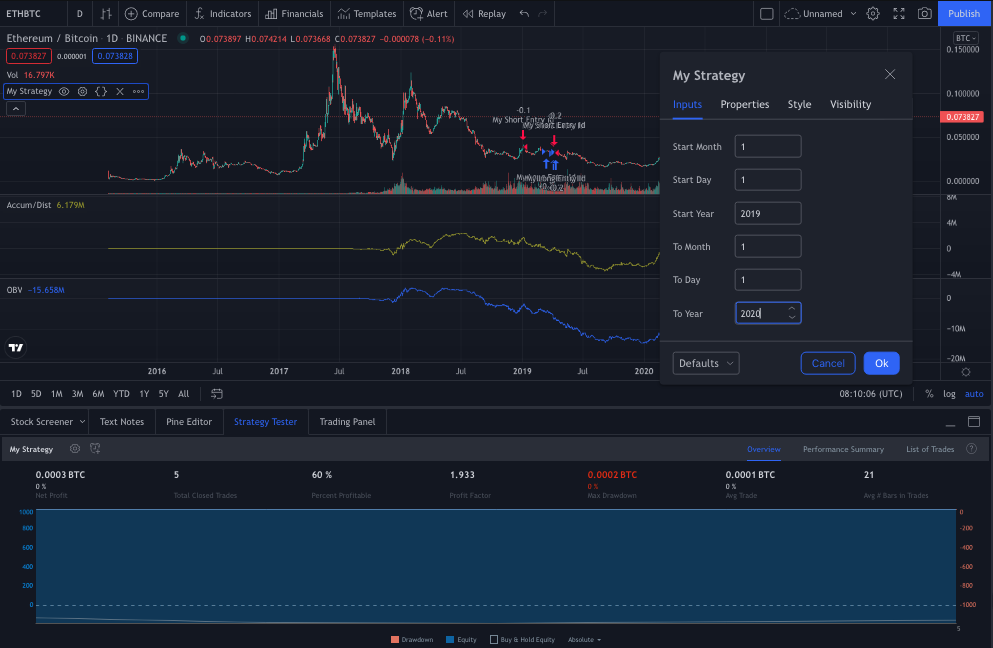
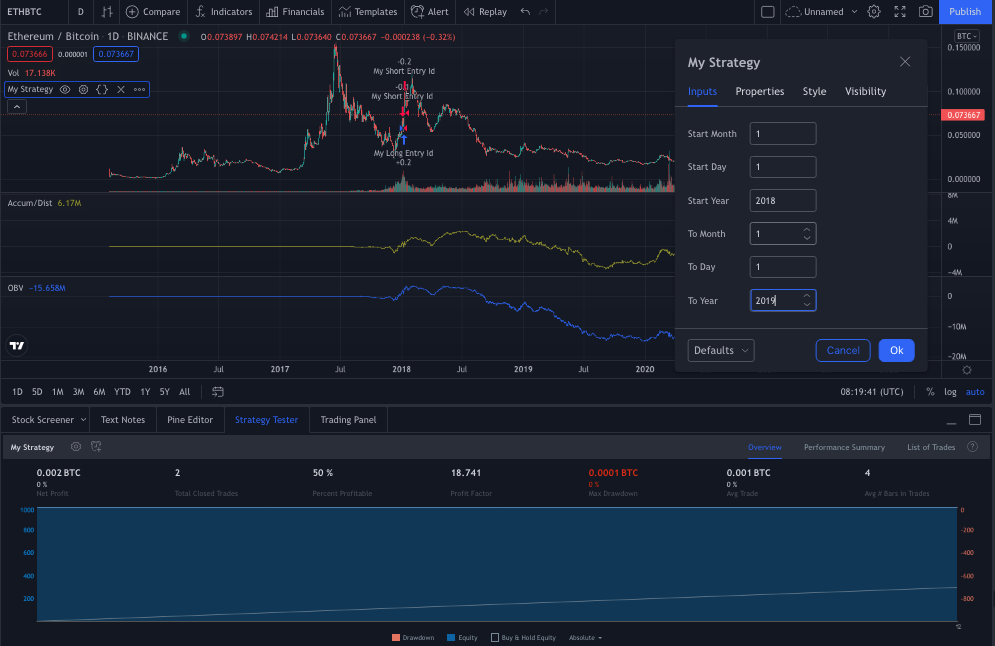
overall, he made 3.3 profit factor from 2016-2022 with 45% profitable, whereas mine was 5.3 and 70% profitable
//@version=4
strategy("My Strategy", overlay=true, initial_capital=1000, commission_type = strategy.commission.percent, commission_value = 0.2)

//date/time
fromMonth = input(defval=1, minval=1, title="start Month")
fromDay = input(defval=1, minval=1, title="start Day")
fromYear = input(defval=2016, minval=2014, title="start Year")
toMonth = input(defval=1, minval=1, title="to Month")
toDay = input(defval=1, minval=1, title="to Day")
toYear = input (defval=2017, minval=2014, title="to Year")

timeInRange = (time > timestamp(fromYear, fromMonth, fromDay, 00, 00)) and (time < timestamp(toYear, toMonth, toDay, 23, 59))

// the trades
longCondition = close > accdist [1]
if (longCondition and timeInRange)
    strategy.entry("My Long Entry Id", strategy.long, qty=0.1)

shortCondition = close < accdist [1]
if (shortCondition and timeInRange)
    strategy.entry("My Short Entry Id", strategy.short, qty=0.1)
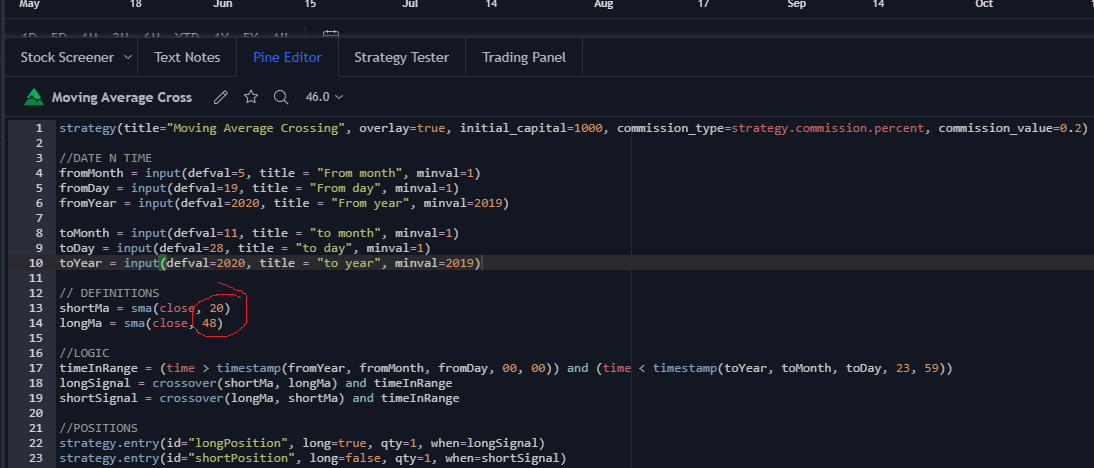
versus his in relevant part
plot(sma(close, 20))
plot(sma(close, 50))

// the trades
longCondition = crossover(sma(close, 20), sma(close, 50)) //close > ta.accdist[3]
if (longCondition and timeInRange)
    strategy.entry("My Long Entry Id", strategy.long, qty=0.1)

shortCondition = crossover(sma(close, 50), sma(close, 20))  //close > ta.accdist[3]
if (shortCondition and timeInRange)
    strategy.entry("My Short Entry Id", strategy.short, qty=0.1)
1 Like