
Welcome to this discussion thread. Feel free to ask questions or discuss things related to this section.
Hi Filip, do you advise the backtest on the same asset in other periode or on a complete other asset ? Kr. Roland
Same asset is recommended
Hi Filip, I may be wrong and it is not really important but to model your simple Bart Simpson strategy you should go short when close-open>100 and volume>1000.
In the step3 video you said you buy at market if these conditions are met.
4 Likes
Hi all, Hi Filip, I have some trouble to grasp how a stop loss works when shorting something. I can understand that for example if I short bitcoin and it suddenly moons that I would be wiped out. Going short means, that I borrow and sell something that I do not own. In case of shorting BTC I have to borrow BTC from someone else, sell them and return on a later point in time.
Lets assume I borrow a bitcoin at 3000$ and I open a short position with a stop loss at 3300$. But magically bitcoin soared to 4500$ rapidly (for example due to halving or other good news) and remains there for too long.
I have to purchase the BTC back to the person I borrowed it from, at market price now, no matter if I placed the stop loss, right? So how can a stop loss work in a short position, if I do not hold any instrument anymore? The stop loss does not magically return the BTC to me at the stop loss level.
2 Likes
Hi Mad, excellent question. Let me see if I can clarify it. You are completely correct when you describe the shorting of bitcoin. But stop losses works in both long and short positions.
In your scenario where bitcoin would soar to 4500, your stop loss would trigger at 3300 since it passed that level. But if there is no sell order at that level, matching your buy order. You stop loss order will buy at the best possible price to get your out of your position (market order). So if the price soars to 4500 without any sell orders in between 3000 and 4500, then yes, you would get out at 4500.
But the exactly the same would happen in a long scenario. You can just flip the script. You go long at 4500, have your stop loss at 4200. Then the price suddenly drop to 3000 and there are no buy orders in between to match your sell order. Then you would have to sell your bitcoin and close your position at 3000, the best possible rate where there are orders that matches yours.
4 Likes
Hi Filip! So…how do we properly test our strategies on crypto assets when BitCoin began at the bottom of 2009? There isn’t any real data as to how it performs in a real global bear market. Could we train on stock data to get a full economic cycle then back-test vs. crypto data?
1 Like
Filip! Question on position size. Sure, limit your risk to 1% of your portfolio. But on the bottom end shouldn’t you size positions so that your reward/risk ratio remains above 2 after taking spread and transaction fees, and possibly taxes into both sides? There is a minimum size below which all your reward is eaten by frictional costs.
Also: from manual trading position size is a matter of how many open positions you’re willing to manage at once. I’ve been told no more than 3 starting out, and ten was the old limit for pros.
1 Like
Good question. I wouldn’t want to use for example stock market data and backtest a bitcoin trading algo. It wouldn’t make sense to me, because those markets are completely different. They don’t share much in common.
As another example, I’ve never seen people develop an algo for EUR/USD and backtests it on EUR/GBP.
But, your question is still a very valid one. Because the bitcoin data set is very limited, so this is a unique situation. I would however, still only use the bitcoin data and do the best I can. Maybe eliminate the very early data and only use the last 3-4 years. That’s not a lot of data, but it’s the best we can get unfortunately.
That would be my view of it.
On your second question regarding position size.
I agree, never take trades with less than 2 in reward/risk. I wouldn’t take taxes into that calculation though, but I guess that depends on where you live and your tax policy. If you pay taxes on every gain for example, then you need to calculate with it. If you pay taxes on your yearly returns, I wouldn’t. No advice, ask your tax professional 
1 position can be hard enough in the beginning imo. But this is of course different if we are talking algos.
4 Likes
Hi Filip! Thank you for the good and detailed explanation. Man, what would be a good period of time for back testing the strategy? Cryptocurrency doesn’t have that long of a history. How can it be accurate? Thank you
2 Likes
It’s hard to say. First of all it depends on your time frame. Are you using daily or 1-minute time frame.
Usually you would say the more data the better. But I think some would argue that crypto markets have changed quite a lot since 2011 and that by including that old data you would be misled.
It’s also a good idea to test over different market cycles. If I were in your shoes, I would probably make sure I try my algorithm over the previous bull run and the previous/current bear market. But depends on your algo and time frame. If you only get 2-3 trades during that time it will obviously be very hard to get any knowledge out of that.
I hope that helped you a little bit 
2 Likes
I am understanding up to this point and looking to learn these strategies because it is informative and exciting to me.Can you also do this on a small scale if you don’t have a big sum of money?
Hey guys,
Here’s a simple idea: noticed that when looking at prices per minute for ETHUSDT, there is a pattern where price jumps up or down only after three consecutive 1 minute candles are either positive or negative respectively.
//First I have this safety net to catch a big market crash. The price is derived from the March 12 crash related to corona virus. I figure people will want to avoid that happening again.
Loop
(P < 190 short
until (P(t - 48h) + Pt >= 0)
where t = current time)
//Here is the 3 minute buy/ sell idea.
Pc + P(c + 3) > 0
=> buy at market
Pc + P(c + 3) < 0
=> short at market
where c = 1 minute candle
//Excited to try it out. I’m not sure how I would actually code a program to take three consecutive 1 minute candles and test whether the group is positive or negative, but hopefully the above gets the idea across.
Actually I changed:
Pc + P(c + 3) > 0
=> buy at market
Pc + P(c + 3) < 0
=> short at market
To:
Loop(
Pc > 0(
P(c+1) > 0(
P(c + 2) > 0 Buy))
Pc < 0(
P(c+1) < 0(
P(c + 2) < 0 Short))
Because I want the program to check if there are three consecutive 1minute candles that are either positive or negative, not just take three and see if the difference is positive or negavitve.
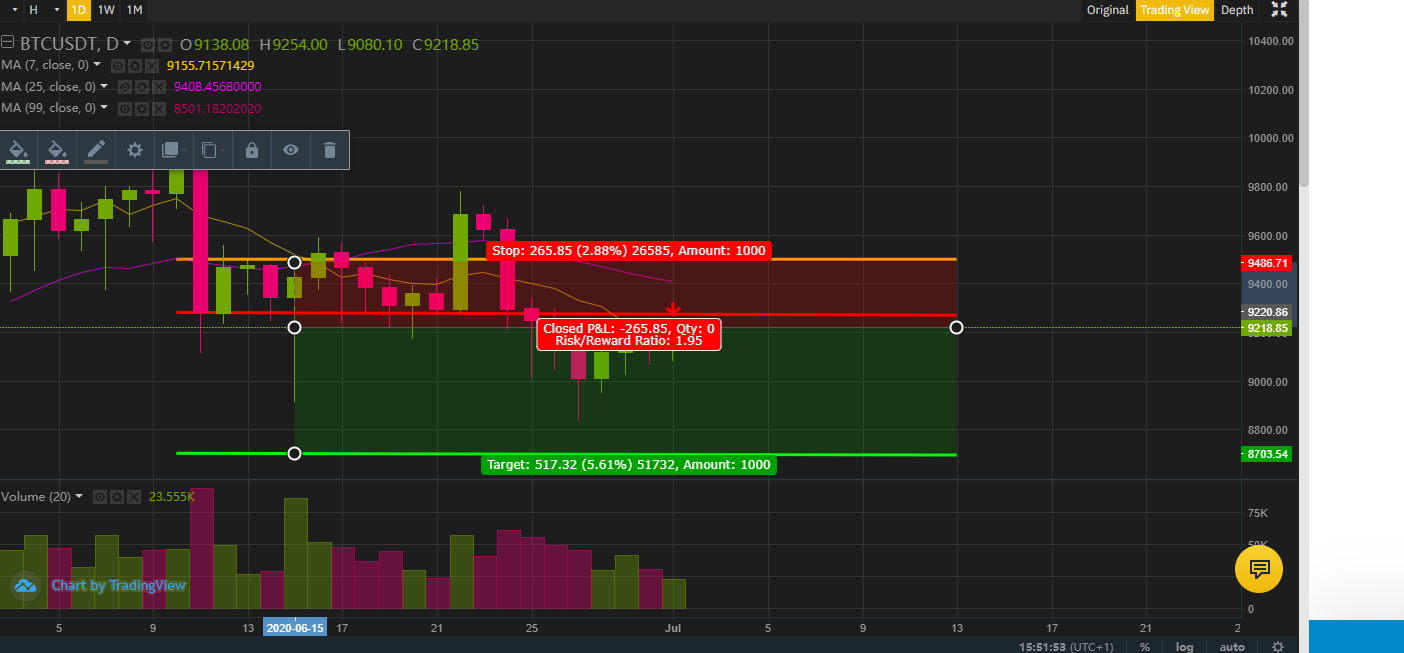
Hi All, Hi Filip. I am having trouble understanding Stop Limit order or Binance Exchange. Can anyone help me out with a proposed trade i am trying to execute.
I want to pull the trigger at 9220.86 to short and make profit till lets say 8703.54 and the stop loss is 9486.71 at the top of the pic.
Can anyone help me on how to place this order on Binance format? its really wrecking my head how i cant figure it out haha.
Once im shown this i then can move on with the course
Thanks Filip great course so far…
Kind regards.
I am really new at this, so I would first need to learn more about different indicators, patterns, but surely I would try a bunch of different strategies on the historical data and see how it measures. For the moment I would have the following strategy in mind:
- Focus only on accumulating crypto on long term, something like dollar cost averaging in but based on a combination of different indicators. I will also need to think about a formula to dedicate a percentage for playing around with different indicators, so I play on the short term to help the long-term accumulated value. I will set a base value that will evolve with the rate of accumulation. After more is accumulated over time, a big percentage of that new accumulated value would become the new base. If the buy/sell of the small percentage isn’t profitable, it won’t eat into the base target.
- I would buy only when the value is under the 200 and 50 moving averages. If I am looking at bitcoin, I would also factor in the hash ribbons buy indicator. If all of these indicators match the criteria, I would add to my position.
- For selling strategy, I don’t have a clear one in terms of what indicators I should watch for long term taking profits. For the moment I would set a target of accumulated nr of coins that I want to reach. After that, I would set price targets for exit strategy. If for example I have 10 btc. If btc would hit 25k, I would sell 10%, when it hits 40, sell another 20%, when it reaches 80k, sell 40%, etc.
For a safer choice, I would also check the price levels at a few different exchanges, so I won’t make the decision based only on an exchange glitch or temporary issue.
Hello friends,
The risk/reward video is confusing me a bit. Why is the take-profits line lower than the entry line? it seems like it should be the other way around. Also, why is the stop loss line placed above both lines? Am i misinterpreting the graphic or the concept? Can someone please clarify?