I guess you refer to tradingview, pine script languange, you will learn how to code it yourself later into this course. 
If you have any more questions, please let us know so we can help you! 
Carlos Z.

I guess you refer to tradingview, pine script languange, you will learn how to code it yourself later into this course.
If you have any more questions, please let us know so we can help you!
Carlos Z.
Nice! literally the next video had the answer lol!
I am considering about building a strategy to increase DOT. So looking at the DOT/USDT pair on Kucoin, if one bought at $ 3.5 - 4 (2/2 August), then could have sold at 50 % profit, around $ 7, then use the 50 % to DCA over time, rebuying down to $ 4, then again selling on the uprise.
Ideally (what does not exists in practice - perfect trades), if I semplify would be applyng this strategy selling 50 % when the price doubles, rebuy when it halves again, and now (today is the 31st December 2020) resell 50 % at $ 8.
But if we diversify and apply this strategy in few tokens, we have a ‘guarantee’ of +, that we can use to repurchase or invest in other tokens, then repeat the 50 % sell at doubled price. Repeat again.
Hi Filip! Thank you for this wonderful course.
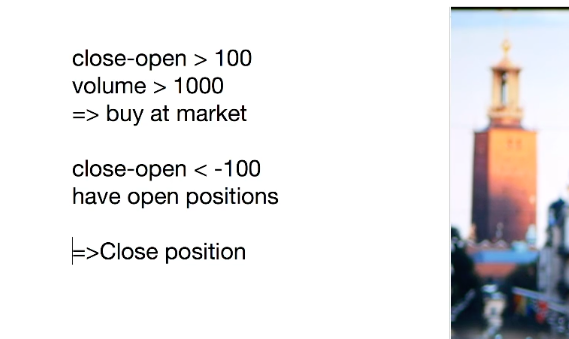
I have a question about the “points” you discussed when measuring a candle.
So for a green candle close is larger than open. To measure the candle we will need to subtract open fro, close which will equal to candels size in POINTS.
So when we are subtracting, are we using PRICE of open and close position? Are candles measured in currency (usd, eur, btc etc)? If yes, than we are talking about points=price change?
@filip
i also have a question about this, I’m not sure how to measure the “points” of a candlestick. Did you ever find out the answer? @Jekaterina
If the candle is red: the open is at the top of the body and the close is at the bottom of the body.
If the candle is green: the open is at the bottom of the body and the close is at the top of the body.
The wicks are the absolute highs and lows during the time period.
Hope that helps a little…
thanks for replying, I should of been more specific but I was wondering how to measure if a candle is more or less than 100 “points” in reference to one of filip’s videos but I believe I found the answer
Hey @raerae, hope you are well.
By points you mean the price right? i mean in filip videos, the price was completely different than now, in terms of a candlestick having more or less points than the last one, you mean in price right?
Carlos Z
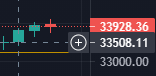
I think so? Filip mentions in the “Step 3: Model” video that for a long position the candlestick would need to be more than 100pts which would be a long green candlestick . And then for a close position -100pts. But I’m not completely sure how to know if a candlestick is measured more or less than 100pts, for example if there’s a formula in case it is useful for programming the strategy. This is the screenshot from the video.
The points are the terms for the price, i’m sure its like this:
For bitcoin:
IF MA (Moving Average) for: 4 hours, is: 33620$
Actual Price is 33672$.
It means the MA is below actual price by 52 points.
It’s apply the same on candles, if one is above in points (green) or below (red).
Hope I explained my self clear, if not let me know
Carlos Z
I did this course back in 2019 on the previous previous platform. As it did not transfer properly I thought it would be a good opportunity for review.
Two thoughts glad I kept studying as the market crashed to 3.5k.  Also review is such an amazing way to discover what you have learned over time.
So many new things to learn in crypto all the time it can seem like an unscalable mountain. Sometimes it’s nice to just look down and respect the climb that took place. The Academy has truly become the best blockchain education site on the internet. @filip @ivan
This makes more sense! Thank you so much for explaining!