1.What is MACD and how is it used?
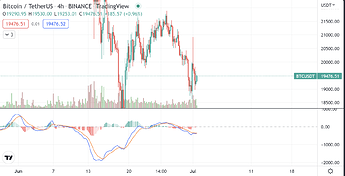
The MACD is made up of two moving averages, which are based on two different time periods.
It is used to indicate points on a chart where the trend might be changing.
This can be determined when the two moving averages cross on the histogram; this can indicate an entry or exit signal for traders.
A MACD has two lines—a fast line and a slow line. A buy signal occurs when the fast line crosses through and above the slow line. Above zero and sustained on the histogram is considered to be in an uptrend;
A sell signal occurs when the fast line crosses through and below the slow line. Below zero and sustained on the histogram is a signal of a downtrend.
2.What is the difference between MACD and RSI?
The MACD helps understand in which direction the trend might be going.
The RSI provides signals as to when there could be a potential shift in the trend.
MACD utilizes two moving averages for indication of trading signals,
RSI uses overbought/oversold indicators to help determine trading signals.
A simple strategy using the RSI indicator is to place a buy close to oversold conditions when the trend is up and place a short near an overbought condition in a downtrend.
Example;
“Long-trade” signal is indicated when the RSI moves below 50 and then back above it.
“Short-trade” signal is indicated by the RSI moving above 50 and then back below it.
3.What is OBV and how is it used?
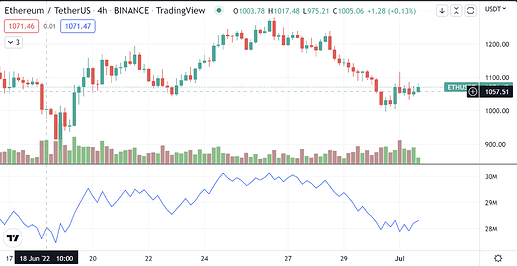
The OBV volume confirms trends by using a single one-line indicator.
The indicator measures cumulative buying and selling pressure by adding the volume on “up” days and subtracting volume on “down” days.
A rising price should be accompanied by a rising OBV;
A falling price should be accompanied by a falling OBV.
If OBV is rising and the price isn’t, it’s likely that the price will follow the OBV in the future and start rising.
If the price is rising and OBV is flat-lining or falling, the price may be near a top.
If the price is falling and OBV is flat-lining or rising, the price could be nearing a bottom.


