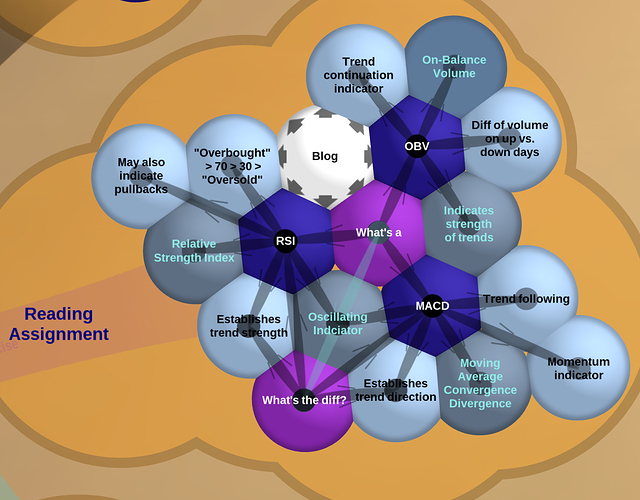
- What is MACD and how is it used?
according to investopedia MACD is a trend-following and momentum indicator of an instrument
it consists of 2 waves (moving averages) fluctuating above and below zero (a neutral line/point).
The two moving averages in the indicator are known as the fast and slow lines
A basic MACD strategy is to look at which side of the zero the lines are on in the histogram below the chart and trade accordingly…
A price above 0 for a sustainable period of time and the trend is likely up if the opposite is shown the trend is likely down.
Potential buy signals occur when the MACD crosses above zero, and a potential sell signal is when it crosses below zero.
- What is the difference between MACD and RSI?
The biggest difference is the focus. MACD is focused on trends. (is it up or down?) RSI is focused on individual positions. Has it been over bought (above 70) or oversold (below 30)
note the RSI doesn’t typically reach 30 in an uptrend unless a potential reversal is underway.
An alternate strategy is to buy in oversold conditions while in an up trend and place and “short” when when its down.
- What is OBV and how is it used
OBV is an indicator of “cumulative buying/selling pressure by adding the volume on up days and subtracting volume on down days.”
in other words it adds more data to solidify a trend prediction
" Ideally, volume should confirm trends. A rising price should be accompanied by a rising OBV; a falling price should be accompanied by a falling OBV. "

