Hi guys,
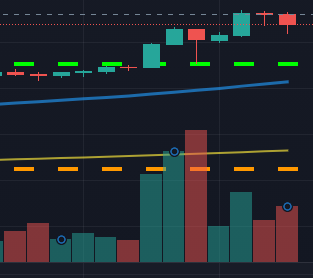
I’m trying to understand what exactly the volume on a Cryptocurrency chart shows; is it number of transactions or is it the volume of BTC sold or bought?
Thanks
M

Hi guys,
I’m trying to understand what exactly the volume on a Cryptocurrency chart shows; is it number of transactions or is it the volume of BTC sold or bought?
Thanks
M
Hey @BigBoi, hope you are well.
The Volume chart represents the amount of BTC sold in a range of time represented in a candle.
In general terms the Volume is the number of shares or unity that is shaded within an specific time period.
Determine the strength or significant move in price, if there is a move in the previous market that is backup with high volumes that means many buyers and sellers are behind this move and therefore more legitim is the move.

If you have any more questions, please let us know so we can help you! 
Carlos Z.
Thanks Carlos, this is what I thought but some explanations online were misleading.
Hello,
Another question around trading volume; why are some candles larger than others but with the same volume?
Thanks