
Fixed. I changed the code from strategy.exit to strategy.close and it compiled without errors.
Trying to create a pine script to back test DeFi borrowing strategy.
I not really sure where to start much appreciated if anyone wants to help.
Using Maker to generate DAI during uptrend each time the loan becomes 450% collateralize it borrows till the loan is 400% collateralize. In a down trend when collateral reaches 250% it gets upped to 300% by buying more ETH with the DAI. Liquidation requires over 70% retrenchment.
1 Like
//changed the close to another entry strategy to just short instead. Interesting results! Thank you!
strategy(title=“MAStrategy”)
m=sma(close, 10)
buy=close > m
sell=close < m
strategy.entry(“buy”, true, 5, when=buy)
strategy.entry(“buy”, false, 5, when=sell)
Hi guys, I have a question for you pinescript geniuses, I am trying to program a simple alertcondition which will fire an alert whenever a condition is true.
However, when testing the alertcondition function I am finding a problem. My alertcondition should never fire with this code, but it does. It fires immediately and i can not understand why. (My Alert option are ‘Only Once’)
Any ideas?
//@version=4
study("Example of alertcondition")
src = input(close)
ma_1 = sma(src, 20)
ma_2 = sma(src, 10)
//c = cross(ma_1, ma_2)
c = 2>3
alertcondition(c, title='Red crosses blue', message='Red and blue have crossed!')
plot(ma_1, color=color.red)
plot(ma_2, color=color.blue)
3 Likes
I am trying to figure out how to test my strategy within just a given period of time. Say i want to test using the 2017 btc/usd chart only. How do i do that?
1 Like
Hi @Tradesmart, hope you are well.
you will have to create a time range variables that define your custom period of time to be test it.
Here is the code that filip explain in further videos to backtesting your strategy based on a time range:
//DATE & TIME
fromMonth = input(defval=1, title="From month", minval=1)
fromDay = input(defval=1, title="From day", minval=1)
fromYear = input(defval=2019, title="From year", minval=2014)
toMonth = input(defval=1, title="To month", minval=1)
toDay = input(defval=1, title="To day", minval=1)
toYear = input(defval=2025, title="To year", minval=2014)
If you have any more questions, please let us know so we can help you! 
Carlos Z.
I have a question , how do you add the arrows that show where you enter and exit a trade when you apply your strategy to the chart? I currently don’t have those arrows.
1 Like
Hi @iceman12276, hope you are ok.
Now arrows can be set with the plotshapes function, it will add a shape in your strategy to help you get a better view on it, here you can read more about it: https://www.tradingview.com/pine-script-docs/en/v4/annotations/Plotting_shapes_chars_and_arrows.html
If you have any more questions, please let us know so we can help you!
Carlos Z.
Hey @filip ,
I hope you are well. I’m doing the algorithmic trading course. I’m at the part where you build out a strategy. When I type the code in pine editor it gives me this error message:
Add to Chart operation failed, reason: line 8: mismatched character ‘\n’ expecting '"
I don’t think the code is wrong;
//@version=4
strategy(title=“MAStrategy”)
m=sma(close, 10)
buy=close > m
sell=close< m
strategy.entry (buy", true, 1, when=buy)
strategy.close(buy", when=sell)
Let me know.
Thanks
Mark
I think you need another " .
strategy.entry (“buy”, true, 1, when=buy) and
strategy.close(“buy”, when=sell)
Thanks Berglund, that was the issue. If you don’t mind, i’m also stuck with the next section.
When i add this to chart, it does not come up with any data in strategy tester.
//@version=4
strategy(title=“Moving Average Crossing”, overlay=true)
//DEFINITIONS
shortMa = sma(close, 20)
longMa = sma(close, 50)
//LOGIC
longSignal = crossover(shortMa, longMa)
shortSignal = crossover(longMa, shortMa)
//POSITIONS
strategy.entry(id=“longPosition”, long=true, when=longSignal)
strategy.entry(id=“shortPosition”, long=true, when=shortSignal)
Thanks again!
The last (//positions) syntax is wrong.
strategy.entry(“Position”, true, when = longSignal)
id is the name of the strategy, this must be the same (id is always the first argument, just the string)
long is the always the second argument, both are required and you must not add the variable name.
when is an optional parameter, and all of those must have the variable name.
strategy.close(“Position”, when = shortSignal)
I do not know if it matters, Filip is using ver3.
I was on the previous section when replying to you…
// This source code is subject to the terms of the Mozilla Public License 2.0 at https://mozilla.org/MPL/2.0/
// © aberglund
//@version=4
strategy(“My MA2-Strategy”,
overlay=true,
initial_capital = 100,
default_qty_type = strategy.percent_of_equity,
default_qty_value = 30,
commission_type=strategy.commission.percent,
commission_value=0.1
)
m1=sma(close, 7)
m2=sma(close, 21)
longSignal = crossover(m1, m2)
shortSignal = crossunder(m1, m2)
plot(m1)
plot(m2)
strategy.entry(“Köp”, true, 100, when=longSignal, comment=“K”)
strategy.close(“Köp”, when=shortSignal, comment=“S”)
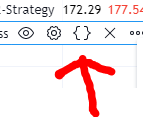
If you want to check out the code of the existing indicators click on the curly brackets and the code will appear in the Pine Editor.
Yes Berglund, you’re a star. 
So that all loaded up fine, so as im continuing to follow the instructions I have no problems until this;
//LOGIC
timeInRange = (time > timestamp(fromYear, fromMonth, fromDay, 00, 00)) and (time < timestamp(toYear, toMonth, toDay, 23, 59))
longSignal = crossover(shortMa, longMa) and timeInRange
shortSignal = crossover(longMa, shortMa) and timeInRange
when i add this 1st line timeInRange, it still loads no problem, when i add (timeInRange) at the end of longSignal and shortSignal, it does not load any data.
Full code below;
//@version=4
strategy(title=“Moving Average Crossing”, overlay=true)
//DATE AND TIME
fromMonth = input(defval=1, title = “from month”, minval=1)
fromDay = input(defval=1, title = “from day”, minval=1)
fromyear = input(defval=2021, title = “from year”, minval=2014)
toMonth = input(defval=1, title = “to month”, minval=1)
toDay = input(defval=1, title = “to day”, minval=1)
toYear = input(defval=2025, title = “to year”, minval=2014)
//DEFINITIONS
shortMa = sma(close, 20)
longMa = sma(close, 50)
//LOGIC
timeInRange = (time > timestamp(fromyear, fromMonth, fromDay, 00, 00)) and (time < timestamp(toYear, toMonth, toDay, 23, 59))
longSignal = crossover(shortMa, longMa) and timeInRange
shortSignal = crossover(longMa, shortMa) and timeInRange
//POSITIONS
strategy.entry(id=“longPosition”, long=true, when=longSignal)
strategy.entry(id=“shortPosition”, long=false, when=shortSignal)
One issue is (perhaps) the predefined variables month, year and to but I am not sure why they are causing a problem within the quotations…
My updated version…
NB Pine is case sensitive.
// This source code is subject to the terms of the Mozilla Public License 2.0 at https://mozilla.org/MPL/2.0/
// © aberglund
//@version=4
strategy(“My MA-Strategy”,
overlay=true,
initial_capital = 1000,
default_qty_type = strategy.percent_of_equity,
default_qty_value = 10,
commission_type=strategy.commission.percent,
commission_value=0.1
)
FromDay = input(defval=1, title = “From Day”, minval=1)
FromMonth = input(defval=2, title = “From Month”, minval=1)
FromYear = input(defval=2020, title = “From Year”, minval=2014)
ToDay = input(defval=1, title = “To Day”, minval=1)
ToMonth = input(defval=5, title = “To Month”, minval=1)
ToYear = input(defval=2020, title = “To Year”, minval=2014)
timeInRange = (time > timestamp(FromYear, FromMonth, FromDay, 00, 00)) and (time < timestamp(ToYear, ToMonth, ToDay, 23, 59))
fsma = input(defval=7, title = “FastMA”, minval=1)
ssma = input(defval=21, title = “SlowMA”, minval=1)
m1=sma(close, fsma)
m2=sma(close, ssma)
longSignal = crossover(m1, m2) and timeInRange
shortSignal = crossunder(m1, m2) and timeInRange
plot(m1, color = color.red, linewidth = 3)
plot(m2, color = color.blue, linewidth = 3)
strategy.entry(“Long”, true, when=longSignal, comment=“Long”)
strategy.entry(“Short”, false, when=shortSignal, comment=“Short”)
Perfect, yes it was the year that needed adjusting.
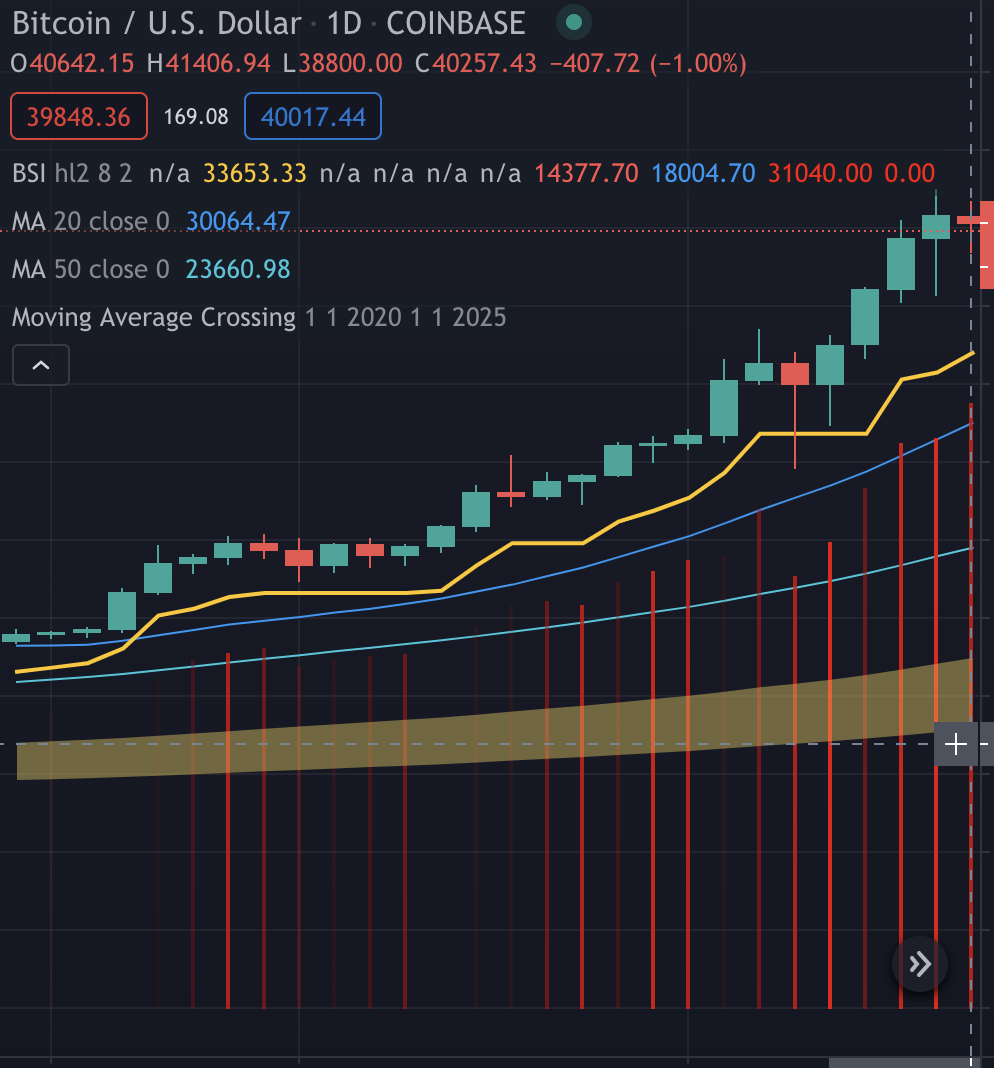
Do you know why, i dont see any data on my chart, they do in the video example
1 Like
ignore that last question. and thanks again.
1 Like
Hi there,
I wrote the same script in the lecture
strategy(title="MAStrategy")

m=sma(close, 10)

buy=close > m
sell=close < m

strategy.entry("entry", true , 1 , when = buy)

strategy.close("entry" , when = sell)
and I add in chart but no result in chart.
On the console appear “The study of the script was added to chart”.
I apreciate if anyone can help. @filip
1 Like