Building a Strategy Discussion

@filip
I tried the using the first example as a template,

strategy(title = “Moving average”)

fromD = input (defval=2, title =“fromD”, minval=1)
fromM = input (defval=2, title =“fromM”, minval=1)
fromY = input (defval=2014, title =“fromY”, minval=2014)

toD= input (defval=2, title =“toD”, minval=1)
toM = input (defval=2, title =“toM”, minval=1)
toY = input (defval=2021, title =“toY”, minval=2014)
timeInRange = (time > timestamp(fromY, fromM, fromD, 00, 00)) and (time<timestamp(toY, toM, toD, 23, 59))

//Open on green 2 above a green 1
buy = close>high[1] and close[1]>high[4] and close>high[3] and close[2]<low[5] and timeInRange
|//TP on green 6
sell = close[5]<low[8] and close[4]>high[7] and close[3]>high[6] and close[2]>high[5] and close[1]>high[4] and close>high[3] and timeInRange

strategy.entry(“buy”, true, 5, when = buy)
strategy.close(“buy”, when = sell)

Bit it gives me the same error.

Hi @filip,

So here’s the code from our assignment written in Trading View, however, I think I’m missing something as I am unable to add it to the chart. It says there are errors of undeclared longSignals and shortSignals under //LOGIC and errors in the two lines of code under //POSITIONS. Any ideas? Would using a Macbook cause problems? Thanks!

//@version=3
strategy(title=“Moving Average Crossing”, overlay=true, initial_capital=2000, commission_type=strategy.commission.percent, commission_value=0.2)

//DATE AND TIME
fromMonth=input(defval=1, title =“fromMonth”, minval=1)
fromDay=input(defval=1, title =“fromDay”, minval=1)
fromYear=input(defval=2019, title =“fromYear”, minval=2014)

toMonth=input(defval=1, title =“toMonth”, minval=1)
toDay=input(defval=1, title =“toDay”, minval=1)
toYear=input(defval=2020, title =“toYear”, minval=2014)

//DEFINITIONS
shortMa= sma(close, 20)
longMA= sma(close, 50)

//LOGIC
timeInRange = (time > timestamp (fromYear,fromMonth,fromDay, 00, 00)) and (time < timestamp(toYear,toMonth,toDay, 23, 59))
longSignal = crossover(shortMa, longMa) and timeInRange
shortSignal = crossover(longMa,shortMa) and timeInRange

//POSITIONS
strategy.entry(id=“longPosition”, long=true, qty=0.1, when=longSignal)
strategy.entry(id=“shortPosition”, long=false,qty=0.1, when=shortSignal)

2 Likes

Hi @filip, I’m getting the following errors for my code.below:

Add to Chart operation failed, reason: line 11: Unknown argument titile of type literal string;

line 11: Unknown argument minval of type literal integer;

line 11: Cannot call input with arguments (defval=literal integer, titile=literal string, minval=literal integer); available overloads: input(const bool, const string, const string, bool, const string) => bool; input(const integer, const string, const string, integer, integer, bool, integer, [const integer…], const string) => integer; input(const float, const string, const string, float, float, bool, float, [const float…], const string) => float; input(const string, const string, const string, bool, [const string…], const string) => string; input(series, const string, const string, const string) => series;

strategy(title = “Moving Average Crossing real”, overlay = true, initial_capital = 600, commision_type = “strategy.commission.percent”, commission_value = 0.2 )

//Date and time
fromMonth = input(defval = 1, title = “From monnth”, minval=1)
fromDay = input(defval = 1, title = “From day”, minval=1)
fromYear = input(defval = 2019, title = “From year”, minval=2014)

ToMonth = input(defval = 1, title = “To monnth”, minval=1)
ToDay = input(defval = 1, title = “To day”, minval=1)
ToYear = input(defval = 2019, title = “To year”, minval=2014)

//Definitions
shortMa = sma(close,20)
longMa = sma(close,50)

//Logic
timeInRange = (time > timestamp(fromYear, fromMonth, fromDay, 00, 00)) and (time < timestamp(ToYear, ToMonth, ToDay, 23, 59))
longSignal = crossover(shortMa, longMa) and timeInRange
shortSignal = crossover(shortMa, longMa) and timeInRange

//Positions
strategy.entry(id = “longPosition”, long=true, qty = .05 when = longSignal)
strategy.entry(id= “shortPostion”, long=false, qty = .05 when = shortSignal)

I copied the strategy verbatim from the tweak lesson, Please assist.

Hello @filip!

Thank you so much for your hard work!

This morning, when I’ve opened the Tradingview, their site was in process of upgrade. I was trying to follow every single step that you were doing, but it seems like I can’t catch the same overview when you were practicing the time period from 15/02/2018 to 15/05/2018. It says ‘‘no data’’ in overview field once I click apply to the Strategy tester.
I’m completely new to this all and perhaps doing something wrong, but really got stuck on this one. Could it be anything to do with the whole website update?

//@version=3

strategy(title=“Moving Average Crossing”, overlay=true)

//DATE AND TIME
fromMonth = input(defval=1, title = “From month”, minval=1)
fromDay = input(defval=1, title = “From day”, minval=1)
fromYear = input(defval=2019, title = “From Year”, minval=2014)

toMonth = input(defval=1, title = “to month”, minval=1)
toDay = input(defval=1, title = “to day”, minval=1)
toYear = input(defval=2025, title = “to Year”, minval=2014)

//DEFINITIONS
shortMa = sma(close, 20)
longMa = sma(close, 50)

//LOGIC
timeInRange = (time > timestamp(fromYear, fromMonth, fromDay, 00, 00)) and (time < timestamp(toYear, toMonth, toDay, 23, 59))
longSignal = crossover(shortMa, longMa) and timeInRange
shortSignal = crossover(longMa, shortMa) and timeInRange

//POSITIONS
strategy.entry(id=“longPosition”, long=true, when=longSignal)
strategy.entry(id=“shortPosition”, long=false, when=shortSignal)

Thank you for your time and sorry to be a pain! :slight_smile:

Trying to add RSI as well, but either my conditions are wrong, or they never happen at the same time.


// © iamchaoticcoder

//@version=4
strategy(title="MA Crossover with RSI", overlay=true, initial_capital=2000, commission_type=strategy.commission.percent, commission_value=0.2)
//commission value like Kraken


//Define defaults for Inputs
fromMonth = input(defval =1, title ="from month",minval=1)
fromDay = input(defval =1, title ="to month",minval=1)
fromYear = input(defval =2017, title ="from year",minval=2014)

toMonth = input(defval =8, title ="to month",minval=1)
toDay = input(defval =15, title ="to day",minval=1)
toYear = input(defval =2020, title ="to year",minval=2014)


rsiSource = input(title="RSI Source", type=input.source, defval=close)
rsiLength = input(title="RSI Length", type=input.integer, defval=5)
rsiOverbought = input(title="RSI Overbought Level", type=input.integer, defval=80)
rsiOversold = input(title="RSI Oversold Level", type=input.integer, defval=20)


//Definitions
shortMa = sma(close,32)
longMa = sma(close, 50)

rsiValue = rsi(rsiSource, rsiLength)
isOverbought = rsiValue >= rsiOverbought
isOversold = rsiValue <= rsiOversold

plot(na)
// 

// Plot signals to chart
plotshape(isOverbought, title="Overbought", location=location.abovebar, color=color.red, transp=0, style=shape.triangledown, text="OB")
plotshape(isOversold, title="Oversold", location=location.belowbar, color=color.green, transp=0, style=shape.triangleup, text="OS")


//Logic
timeInRange =(time > timestamp(fromYear, fromMonth, fromDay, 00, 00)) and (time < timestamp(toYear, toMonth, toDay, 23,59))
longSignal = crossover(shortMa, longMa)and timeInRange and isOversold
shortSignal = crossover(longMa,shortMa) and timeInRange and isOverbought

//Positions
strategy.entry(id="longPosition", long=true, qty=0.1, when=longSignal)
strategy.entry(id="shortPosition", long=false, qty=0.05, when=shortSignal)

@filip Is it possible to delete automatically a previous version of the script with te same name using pinescript when adding your new version to the chart?

when removing quotes, error msg:

strategy(title="Moving Average Crossing", overlay=true, initial_capital=2000, commission_type=strategy.commision.percent, commission_value=0.2)
Processing script...

line 5: Undeclared identifier 'strategy.commision.percent'

Hi @filip,
Is it me or everyone else also cannot excess past 2020 data?

Hi everyone, Gosh I didn’t think this part was going to be easy even after following closely the code and strategy closely it kept giving me line errors, but I persevered and finally worked it out my mistakes without asking , I really want to learn how to do this so I will keep up with the study and now that I kind of know what I am doing, looking at other scripts on trading view and one I use which is a paid one, I can now implement it, but I still have a long way to go in the world of understanding code language.
Hope your all doing well.

hi team,
How do I find the “save as” or “new” options as per Filip’s Trading View version?
Mine only shows Save and Open.

Thanks for that pinescript example @filip . Interesting indeed. Could you also please show where I can get tradingview to show candles. For me it only shows a blue line, candles would be so much nicer :slight_smile: !

I googled, but cant find the mentioned bodies in chart settings - symbols. Where do I get those go***mn candles?

Many thanks!

Hi again,

If I let the video roll until the end so that next video should start in 20 seconds, since from today I get this message:

Error: Error: Error: getaddrinfo ENOTFOUND kajabi-storefronts-production.herokuapp.com

Whats going on, problem at my end/ your end?

Thanks again!

Hi filip, thanks again for an awesome course.

I tried the code, but it returns an error when adding to chart:

Add to Chart operation failed, reason: Script could not be translated from: null

How can this be fixed?

My code: strategy(title=“moving Average Crossing”, overlay=true)

// Time and date
fromMonth = input(defval=1, title = “From month”, minval =1)
fromDay = input(defval=1, title = “From day”, minval =1)
fromYear = input(defval=1, title = “From year”, minval =2014)

toMonth = input(defval=1, title = “To month”, minval =1)
toDay = input(defval=1, title = “To day”, minval =1)
toYear = input(defval=1, title = “To year”, minval =2014)

//Derfinitions
shortMa = sma(close,9)
longMa = sma(close, 26)

//LOGIC
timeInRange = (time > timestamp(fromYear, fromMonth, fromDay, 00, 00)) and (time < timestamp(toYear, toMonth, toDay, 23, 59))
longSignal = crossover(shortMa, longMa) and timeInRange
shortSignal = crossover(longMa, shortMa) and timeInrange

//Positions

strategy.entry(id =“longPosition”, long-true, when=longSignal)
strategy.entry(id=“shortPosition”, long=false, when=shortSignal)

my code is darn near identical to yours but i keep getting an error whenever i try to add to chart :S

// This source code is subject to the terms of the Mozilla Public License 2.0 at https://mozilla.org/MPL/2.0/
// © NProniss

//@version=3
strategy(title = "MAstrategy", overlay=true)

shortMa=sma(close, 8)
longMa=sma(close, 21)

longSignal = crossover(shortMa, longMa)
shortSignal = crossover(longMa, shortMa)

strategy.entry(id="longPosition", long=true, when=longSignal)
strategy.close(id="shortPosition", long=false, when=shortSignal)

[Add to Chart operation failed, reason: line 14: Cannot call strategy.close with arguments (id=literal string, long=literal bool, when=series[bool]); available overloads: strategy.close(const string, series[bool]) => void](https://www.tradingview.com/chart/3Qbyc6be/#)

1 Like

The issue is a bad call on .close argument, try to use strategy.entry for your shortPosition, you dont need to use .close in that way.

Carlos Z

1 Like

omg thank you so much :open_mouth:

1 Like

strategy(title=“long vs short MA”, overlay=true, initial_capital=1000, comission_type=“strategy.comission.percent”, comission_value=0.2)

Add to Chart operation failed, reason: line 9: Unknown argument ‘comission_type’ of type ‘literal string’;

line 9: Cannot call ‘strategy’ with arguments (title=literal string, overlay=literal bool, initial_capital=literal integer, comission_type=literal string, comission_value=literal float); available overloads: strategy(const string, const string, const bool, const string, const integer, const integer, const integer, const bool, const bool, const integer, const integer, const string, const float, const float, const string, const bool, const integer, const integer, const bool, const string, const integer, const string, const float, const bool, const string, const string, const string) => void

SORRY ALL… commission, NOT comission

1 Like

I need some help
Add to Chart operation failed, reason: line 13: syntax error at input ‘long’
i don’t understand what I do wrong ?

1 Like

Hey @Cammalleri, hope you are well.

Now I can’t access your chart because is private, would you please share an screenshot of the error message?

Also I will need to check your code.

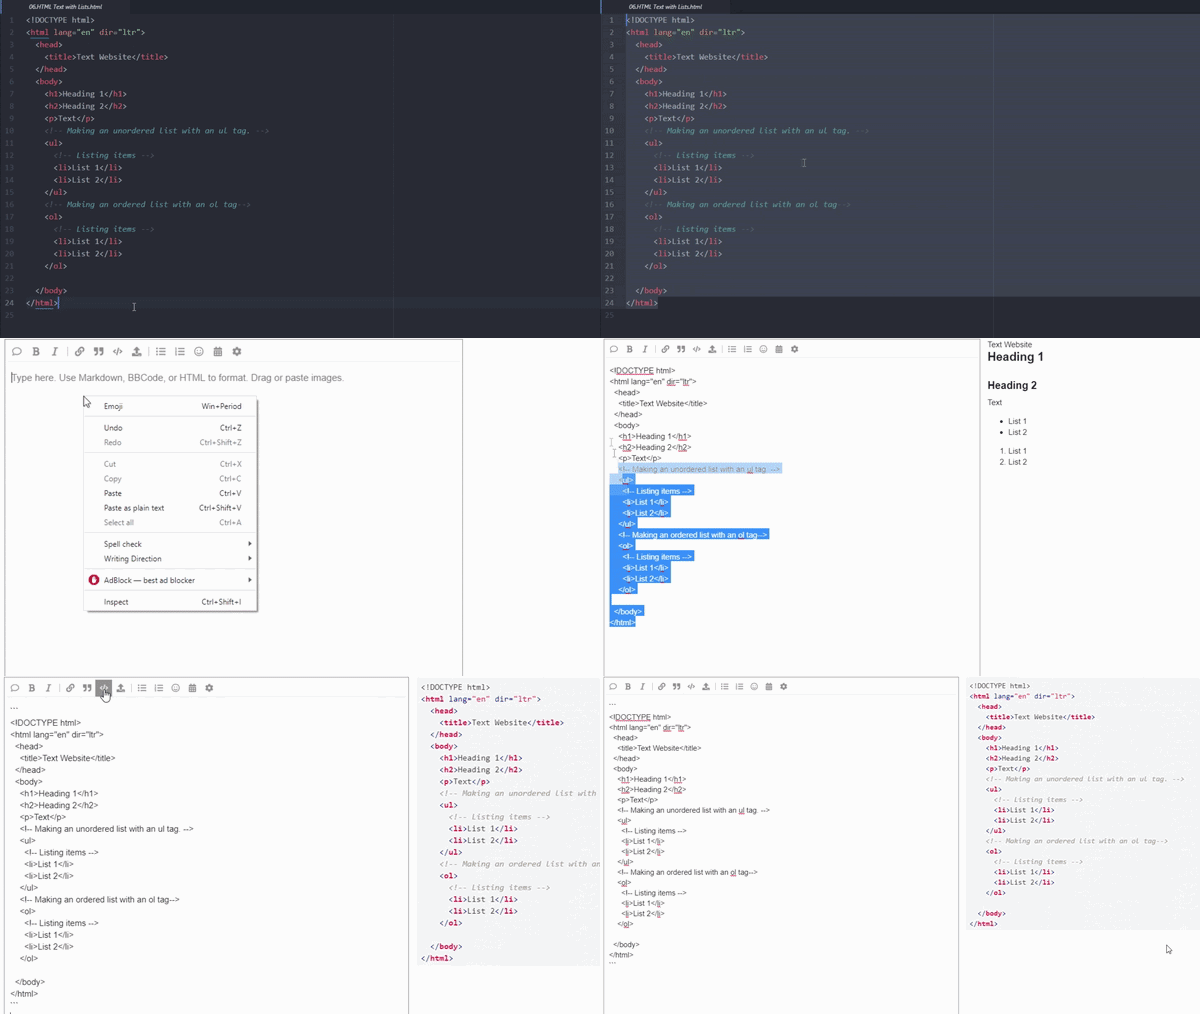
You can use the “Preformatted Text” Button to encapsulate any kind of code you want to show.


function formatText(){

let words = “I’m a preformatted Text box, Please use me wisely!”

}

prefromatted_text-animated

Carlos Z.